Navigation
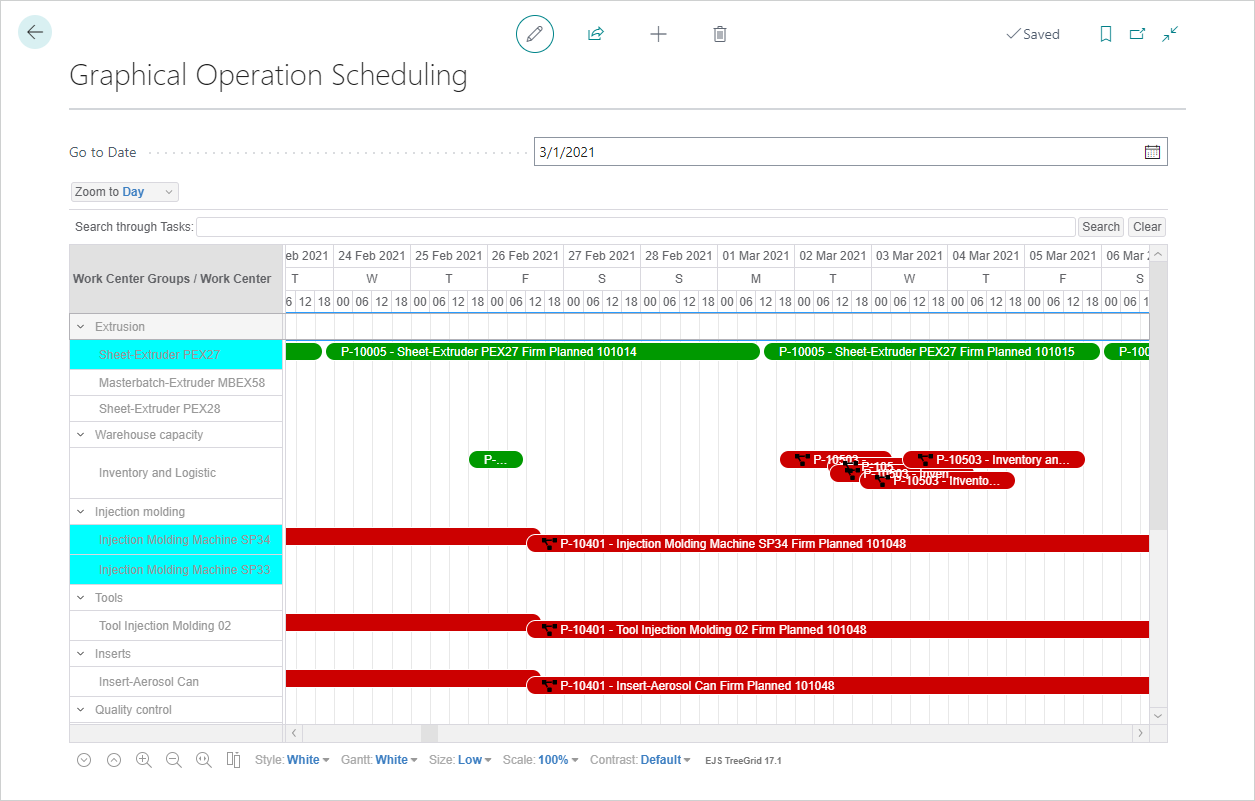
As a graphical interface that shows production information, the Graphical Operation Scheduling page allows you to quickly change to different dates and time periods, search for specific work centers or production orders, change the appearance of the page, and of course, view the production information using a Gantt chart.
This section provides an overview of how to navigate this page, change settings, and so on.

Go to Date
The Go to Date field allows you to move to a specific date in the chart.
Zoom to ...
Just below the Go to Date field is the Zoom to ... drop-down, which allows you to change the view to different time periods. The options are Month, Week, Day, Half Day, Hour, Half Hour, and Minute.
Search through Tasks
Next you can search through work center groups/work centers or production orders. This is a free text field so you can enter full or partial names of work centers or production orders and then press Enter or choose the Search button to find all sequence work centers or tasks with the search criteria. The filtered entries can be cleared by choosing the Clear button.
Searched tasks can be set with a special color in the Selection Color field in the Sequence Planning FastTab on the Graphical Extension Setup page. A searched task will be shown in this color until the search is cleared. Once cleared, the task reverts to its original color.
Chart Layout
The left pane shows the work center groups and sequence work center (aqua = needs to be rescheduled) and the right pane shows the related scheduled production orders (colors can be used to differentiate between standard orders and those with notifications).
For information about working in the Graphical Operation Scheduling page, see Usage.
Context Menus
On both sides of the chart, context menus can be opened to provide additional information about the work center or production order. Tap and hold (or right-click) the work center or production order to open the context menu.
For the work centers:
- The Planning Pool menu item opens the Planning Pool entries for this work center.
- The Work Center Card menu item opens the related work center card.
- The Capacity Ledger Entries, Planning Dimensions, Comments, Load, and Statistics menu items opens the relevant pages for the selected work center.
- The Graphical Maintenance Scheduling menu item opens the scheduling view if the line is a maintenance order.
- The Machine menu item opens the Machines list showing all machines related to the work center.
For the production orders:
- The Components Planning Pool Card menu item opens the Components Planning Pool filtered on the selected production order.
- The Production Order menu item opens the related production order.
- The Production Journal menu item opens the Production Journal if the line belongs to a Released Production Order.
- The Change Status menu item opens the dialog for changing the status of the production order.
- The Item Availability by menu item opens the standard item availability options.
- The Dimensions and Manufacturing Dimensions menu items open the production order information for the specific line.
- The Item Tracking Lines menu item opens the Item Tracking Lines if the item on the production order line is item tracked.
- The Reservation Entries menu item opens the production order information for the specific line.
- The Change Work Center menu item allows you to change from one work center to another while synchronizing between production operation and tool/insert operation. For more information, see Production Order Adjustments.
- The Capacity Conflict Log menu item opens which shows all capacity warnings for the selected production order.
- The Maintenance Order Card menu item opens the related Maintenance Order Card if the line is a maintenance order.
- The Graphical Maintenance Scheduling menu item opens the scheduling view if the line is a maintenance order.
For detailed information about these menu items, see Planning Pool & Sequence Planning and Graphical Maintenance Scheduling.
Tooltips
To view a tooltip for a work center or production order, tap (or hover over) an entry.
Chart Changes
The bottom of the page contains controls that allow you to change the appearance of the chart.
Expand/Collapse all rows
The first two icons allow you to either Expand all rows or Collapse all rows in the left pane of the chart.
Zoom In/Zoom Out/Zoom to fit into page
The third and fourth icons allow you to zoom into or out of the time periods in the right pane of the chart. The fifth icon allows you reset to a month view that will fit into the page.
Displays menu to choose visible columns
The sixth icon allows you to add columns to the chart area. This is especially useful because you can add Start and End Times for the production orders, as well as other production-related information.
Style
The Style drop-down allows you to change the color of the chart area, including text, as well as the control icons at the bottom of the page.
Note
The custom option works with the TreeGrid CSS defined with EJS TreeGrid 17.1.
Gantt
The Gantt drop-down allows you to change the color of the Gantt area of the chart.
Note
The custom option works with the TreeGrid CSS defined with EJS TreeGrid 17.1.
Size
The Size drop-down allows you to change the size (height) of the rows in the chart area.
Scale
The Scale drop-down allows you to change the size of the chart area.
Contrast
The Contrast drop-down allows you to change the contrast between the foreground and background of the chart area.
See Also
Feedback
Senden Sie Feedback für diese Seite . (Beachten Sie, dass diese Umfrage auf Englisch ist.)