Graphical Prod. Capacity Planning
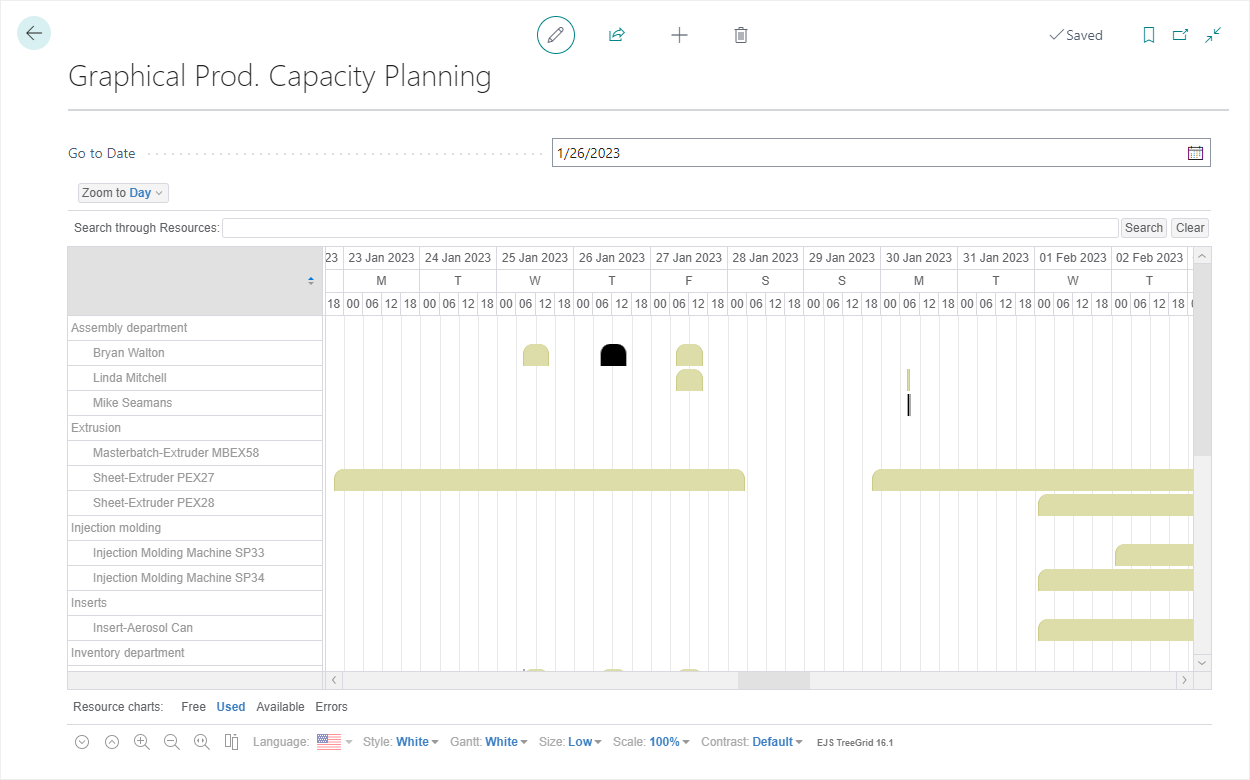
The Graphical Prod. Capacity Planning page uses color coding to show production planners where there are general problems with capacity. This page does not show all production orders, only where there may be overloads for each capacity.
The Graphical Prod. Capacity Planning page is accessed using Tell Me. Choose the  icon, enter Graphical Prod. Capacity Planning, and then choose the related link.

Chart Layout
Work Centers and different Machine Centers (capacities) are in the left pane and the timeline of the capacities are in the right pane.
Resource Charts
Below the chart are the Resource charts options, which determine what capacity information is shown in the chart. Each is described below:
- Free – No filtering, all capacity usage is displayed.
- Used – Shows only the times in which capacities are not available for planning.
- Errors – Shows only the capacities that have overloads.
- Available – Shows only the times is which capacities are available for planning.
Context Menus
On both sides of the chart, context menus can be opened to provide additional information about the capacity or the usage. Tap and hold (or right-click) the capacity or usage to open the context menu.
- The Work Center Card or Machine Center Card menu item opens the related card.
- The Work Center or Machine Center menu item opens another menu with access to Capacity Entries, Comment, Load, and Statistics. For Work Centers, you can also open Dimension information.
- The Planning menu item opens another menu with access to Calendar, Absence, and Task List information for both work centers and machine centers.
Tooltips
To view a tooltip, tap (or hover over) an entry. In the right pane, the tooltips show the Work Center Loads.
Usage
The Graphical Prod. Capacity Planning page provides a wide-range of information about production planning. It can be used as a general overview but also helps you focus attention on problems in your production environment.
Opening Graphical Prod. Order Planning
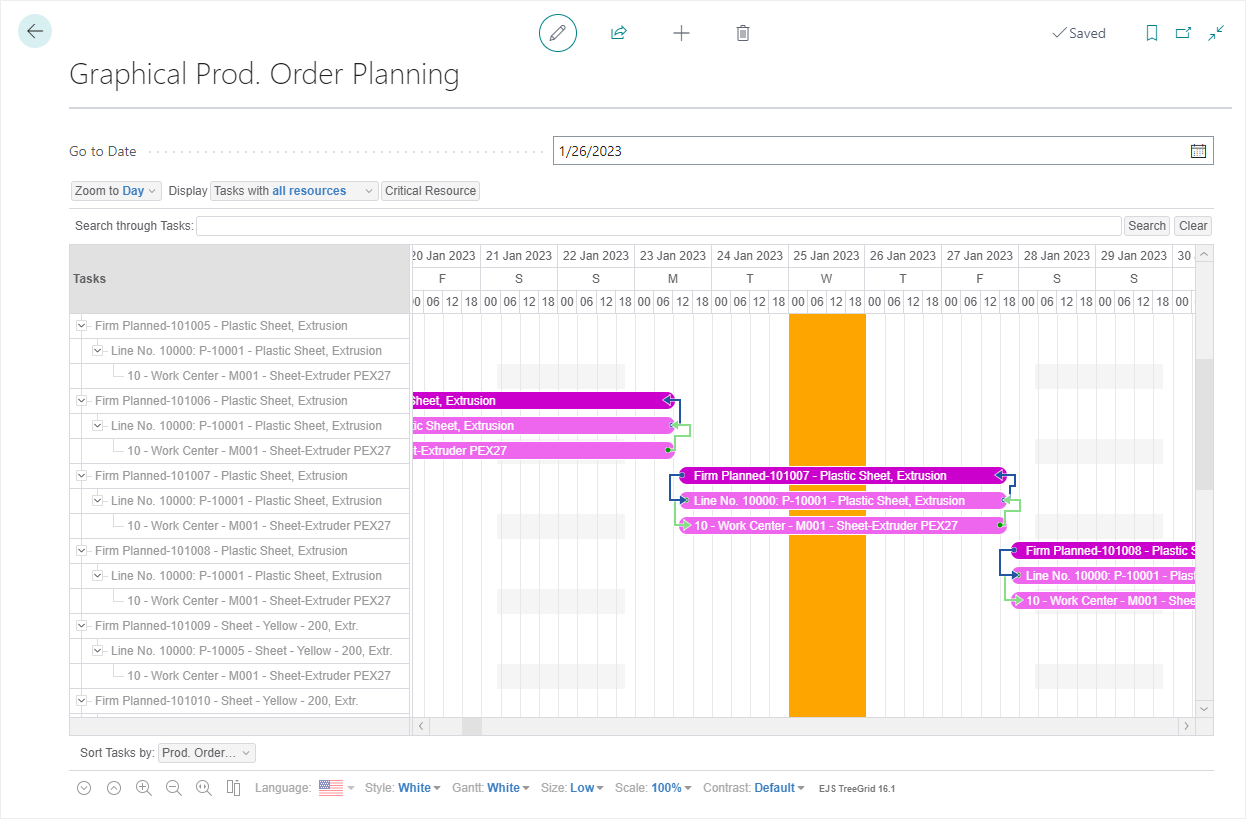
Regardless of the page, you can double-tap (or double-click) any machine center in the timeline to open the Graphical Prod. Order Planning page, which shows all production orders for the related time frame. If using it to check overloads, color coding is used to show exactly where the overload exists.
Opening the Graphical Prod. Order Planning page from the Graphical Prod. Capacity Planning page provides filtering on only critical resources to show problematic work/machine center, which is not available if the Graphical Prod. Order Planning page is opened directly using Tell Me.

Example
There are several production orders for the Bicycle. You check the Graphical Prod. Capacity Planning page and see that there is an overload on January 23, 2025. You double-tap (or double-click) the overload and in the Graphical Prod. Order Planning page, you see all the production orders and routings within this time frame. By choosing the Critical Resource button, only the work center with the overload, 100 Wheel Assembly, remains for each production order. Therefore, you are able to make adjustments to resolve the overload. To remove the filter, choose the Release button.
Critical Adjustments in Graphical Prod. Order Planning
When a critical resource has been identified in the Graphical Prod. Order Planning page, you can move the resources with the standard drag and drop feature. Moving the resources to resolve the overload will adjust the production orders accordingly. After making adjustments, choose the Close button to return to the Graphical Prod. Capacity Planning page. You can see the capacity changes and reopen the Graphical Prod. Order Planning page to make additional adjustments.
Feedback
Submit feedback for this page .