Item Classification (ABC/XYZ Analysis)
The ABC/XYZ Classification page helps you categorize items based on their demand significance (ABC) and demand stability (XYZ), enabling targeted strategies for inventory control and SKU parameter optimization.
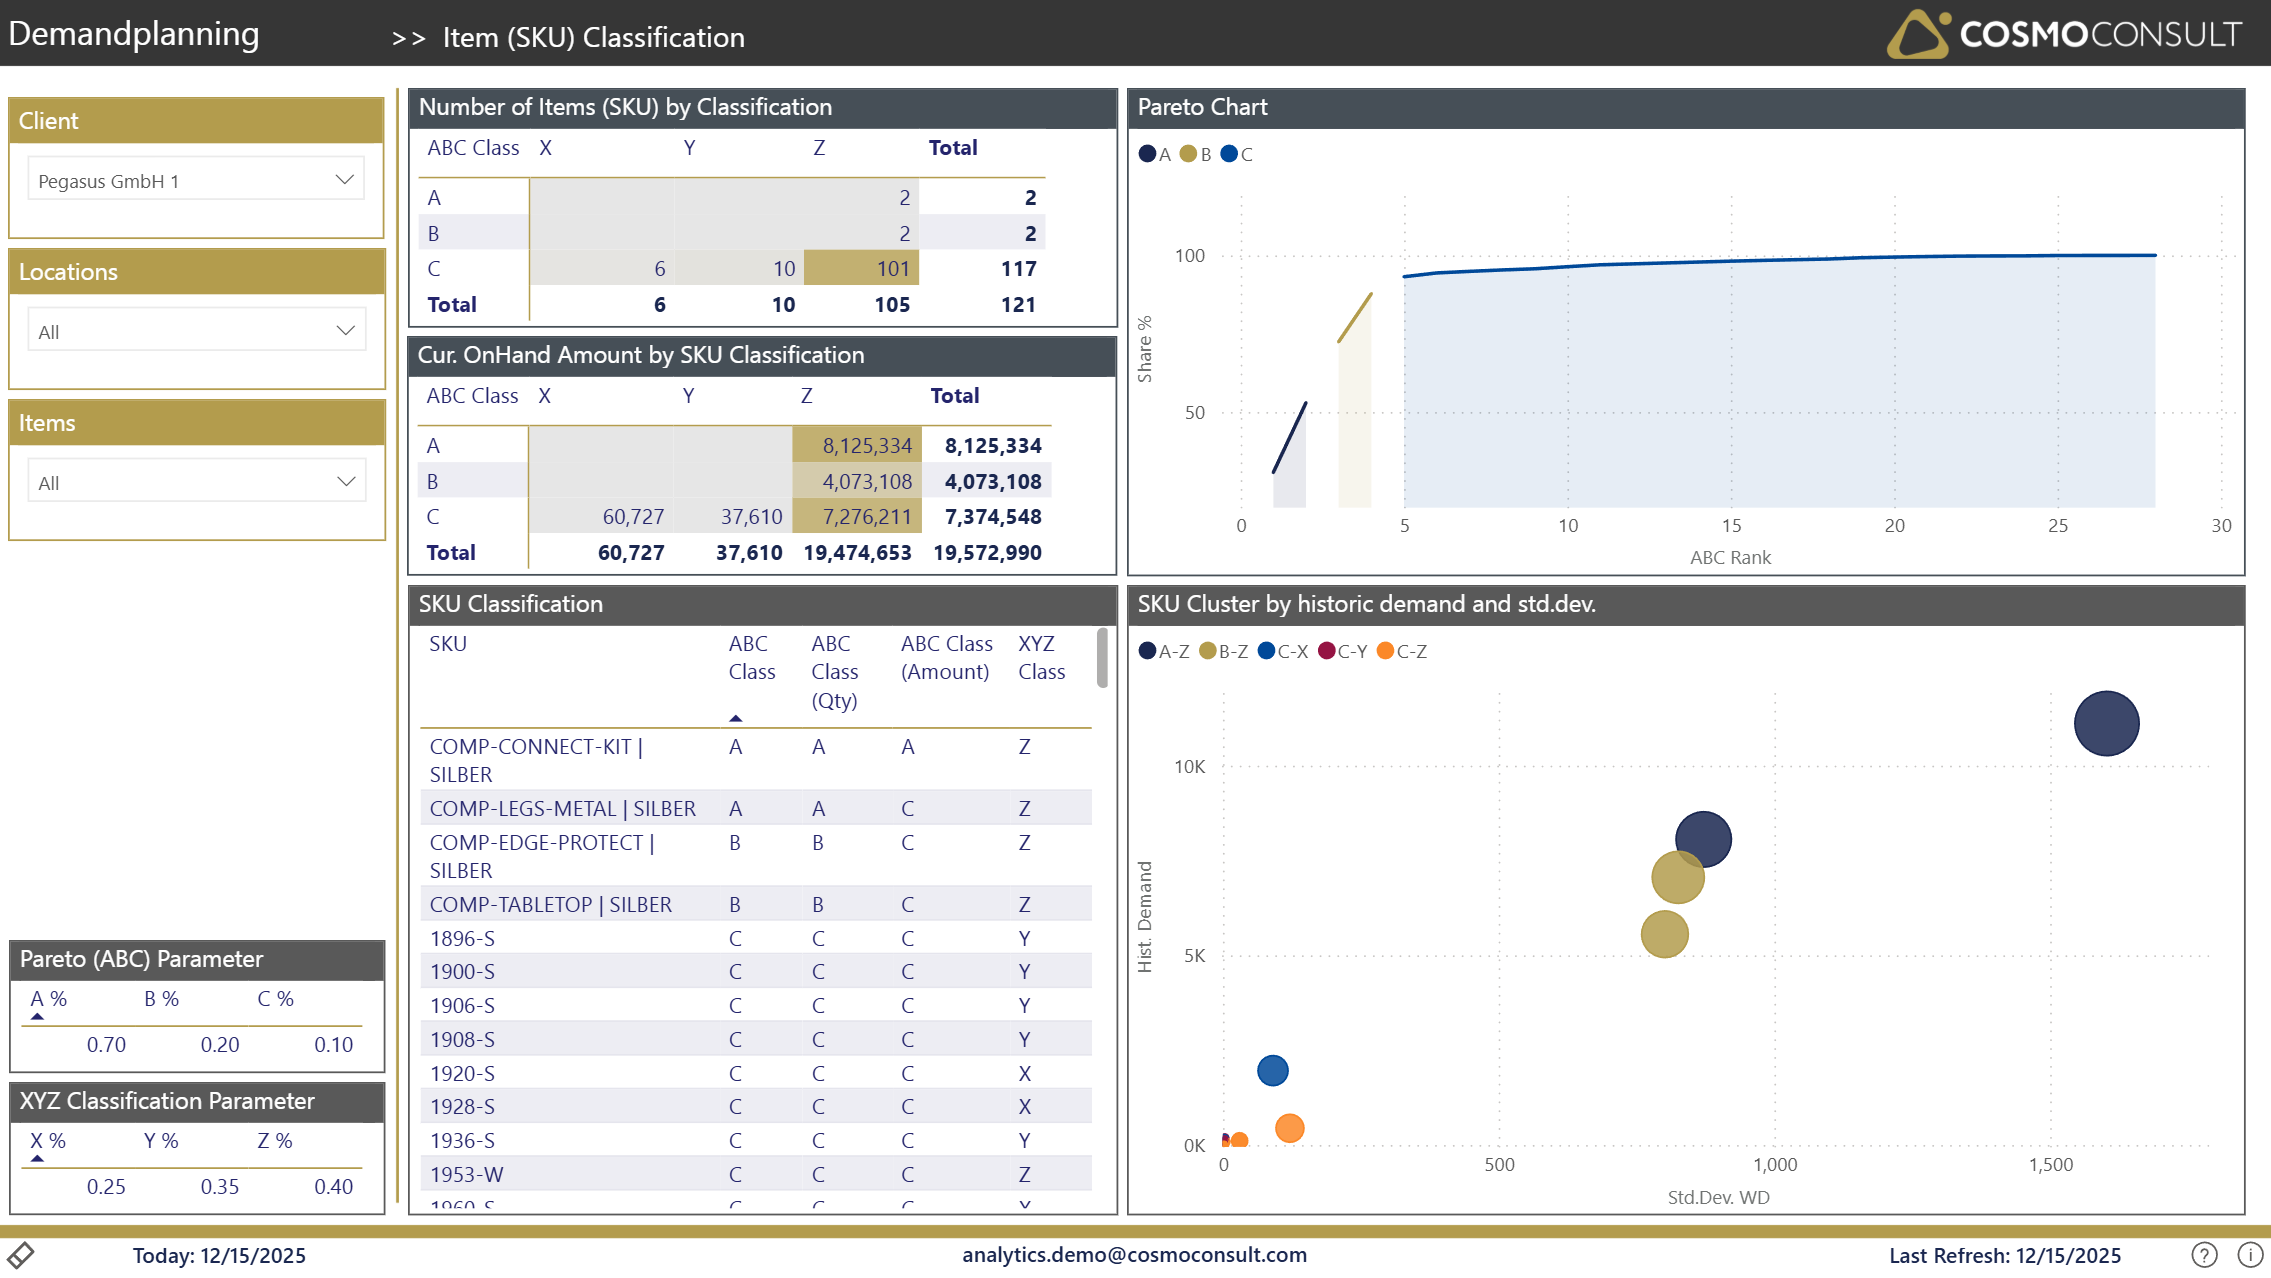
Overview
For optimizing SKU parameters, it's essential to understand both the significance and stability of each item in your inventory. This page provides a comprehensive classification framework:
ABC Classification (Significance):
- A-Items: High-value items representing ~70% of demand value (Pareto principle)
- B-Items: Medium-value items representing ~20% of demand value
- C-Items: Low-value items representing ~10% of demand value
- Parameters can be adjusted according needs
XYZ Classification (Stability):
- X-Items: Stable demand with low coefficient of variation (lowest quantile)
- Y-Items: Moderate demand fluctuation
- Z-Items: Highly variable demand (40% of items with hightest variability)
- Parameters can be adjusted according needs
Filters
Standard filters available for classification analysis:
- Client Selection: Choose the client for multi-tenant scenarios
- Location: Filter by specific warehouses or distribution centers
- Item Selection: Focus on specific items
Key Visualizations
ABC/XYZ Classification Matrix
Interactive matrix showing the distribution of items across the 9 segments:
| X (Stable) | Y (Moderate) | Z (Variable) | |
|---|---|---|---|
| A | AX Items | AY Items | AZ Items |
| B | BX Items | BY Items | BZ Items |
| C | CX Items | CY Items | CZ Items |
Click on any cell to filter the item table to show only items in that segment.
Number of Items (SKU) by Classification
Visual showing:
- Number of items in each ABC category
- Number of items in each XYZ category
- Combined ABC/XYZ distribution
Cur. OnHand Amount by Classification
Visual showing:
- Current inventory value (OnHand Cost Amount) by ABC and XYZ categories to identify where capital is tied up.
SKU Classification Details Table
Comprehensive table with all classified items showing:
- ABC Class: Used classification (either by Quantity or Amount)
- ABC Class (Qty): Classification based on quantity
- ABC Class (Amount): Classification based on value
- XYZ Class: Demand stability classification
Use this table to identify the impact of classification either by quantity or amount to select the most appropriate method for your business.
SKU Cluster by historic demand ad std.deviation
Scatter plot visualizing each item's historic demand against its standard deviation, color-coded by ABC class. This helps to better understand demand variability and impact of clusters.
Use Cases
Understanding Inventory Composition
Gain insights into the distribution of items by value and demand stability to derive inventory strategies.
Derive Priorities
Define focus areas for inventory management based on item classification.
Define Segment-Specific Policies
Establish different inventory control policies (safety stock, reorder points) for each ABC/XYZ segment.