By Location
The By Location page provides a location-centric view of inventory management, enabling analysis of stock levels, movements, and performance across different warehouse locations or distribution centers.
Overview
This page helps you understand inventory distribution and performance across your location network, making it easier to:
- Identify locations with stock imbalances
- Compare inventory turnover across locations
- Monitor stock availability by location
Filters
Standard filters available for analysis include:
- Client Selection: Choose the client for multi-tenant scenarios
- Period Selection: Set the date range for your analysis
- Location: Focus on specific warehouses or distribution centers
- Item Selection: Filter by specific items or item categories
- Item Category: Narrow down to specific product groups
- Item Posting Group: Filter by accounting posting groups
Key Visualizations
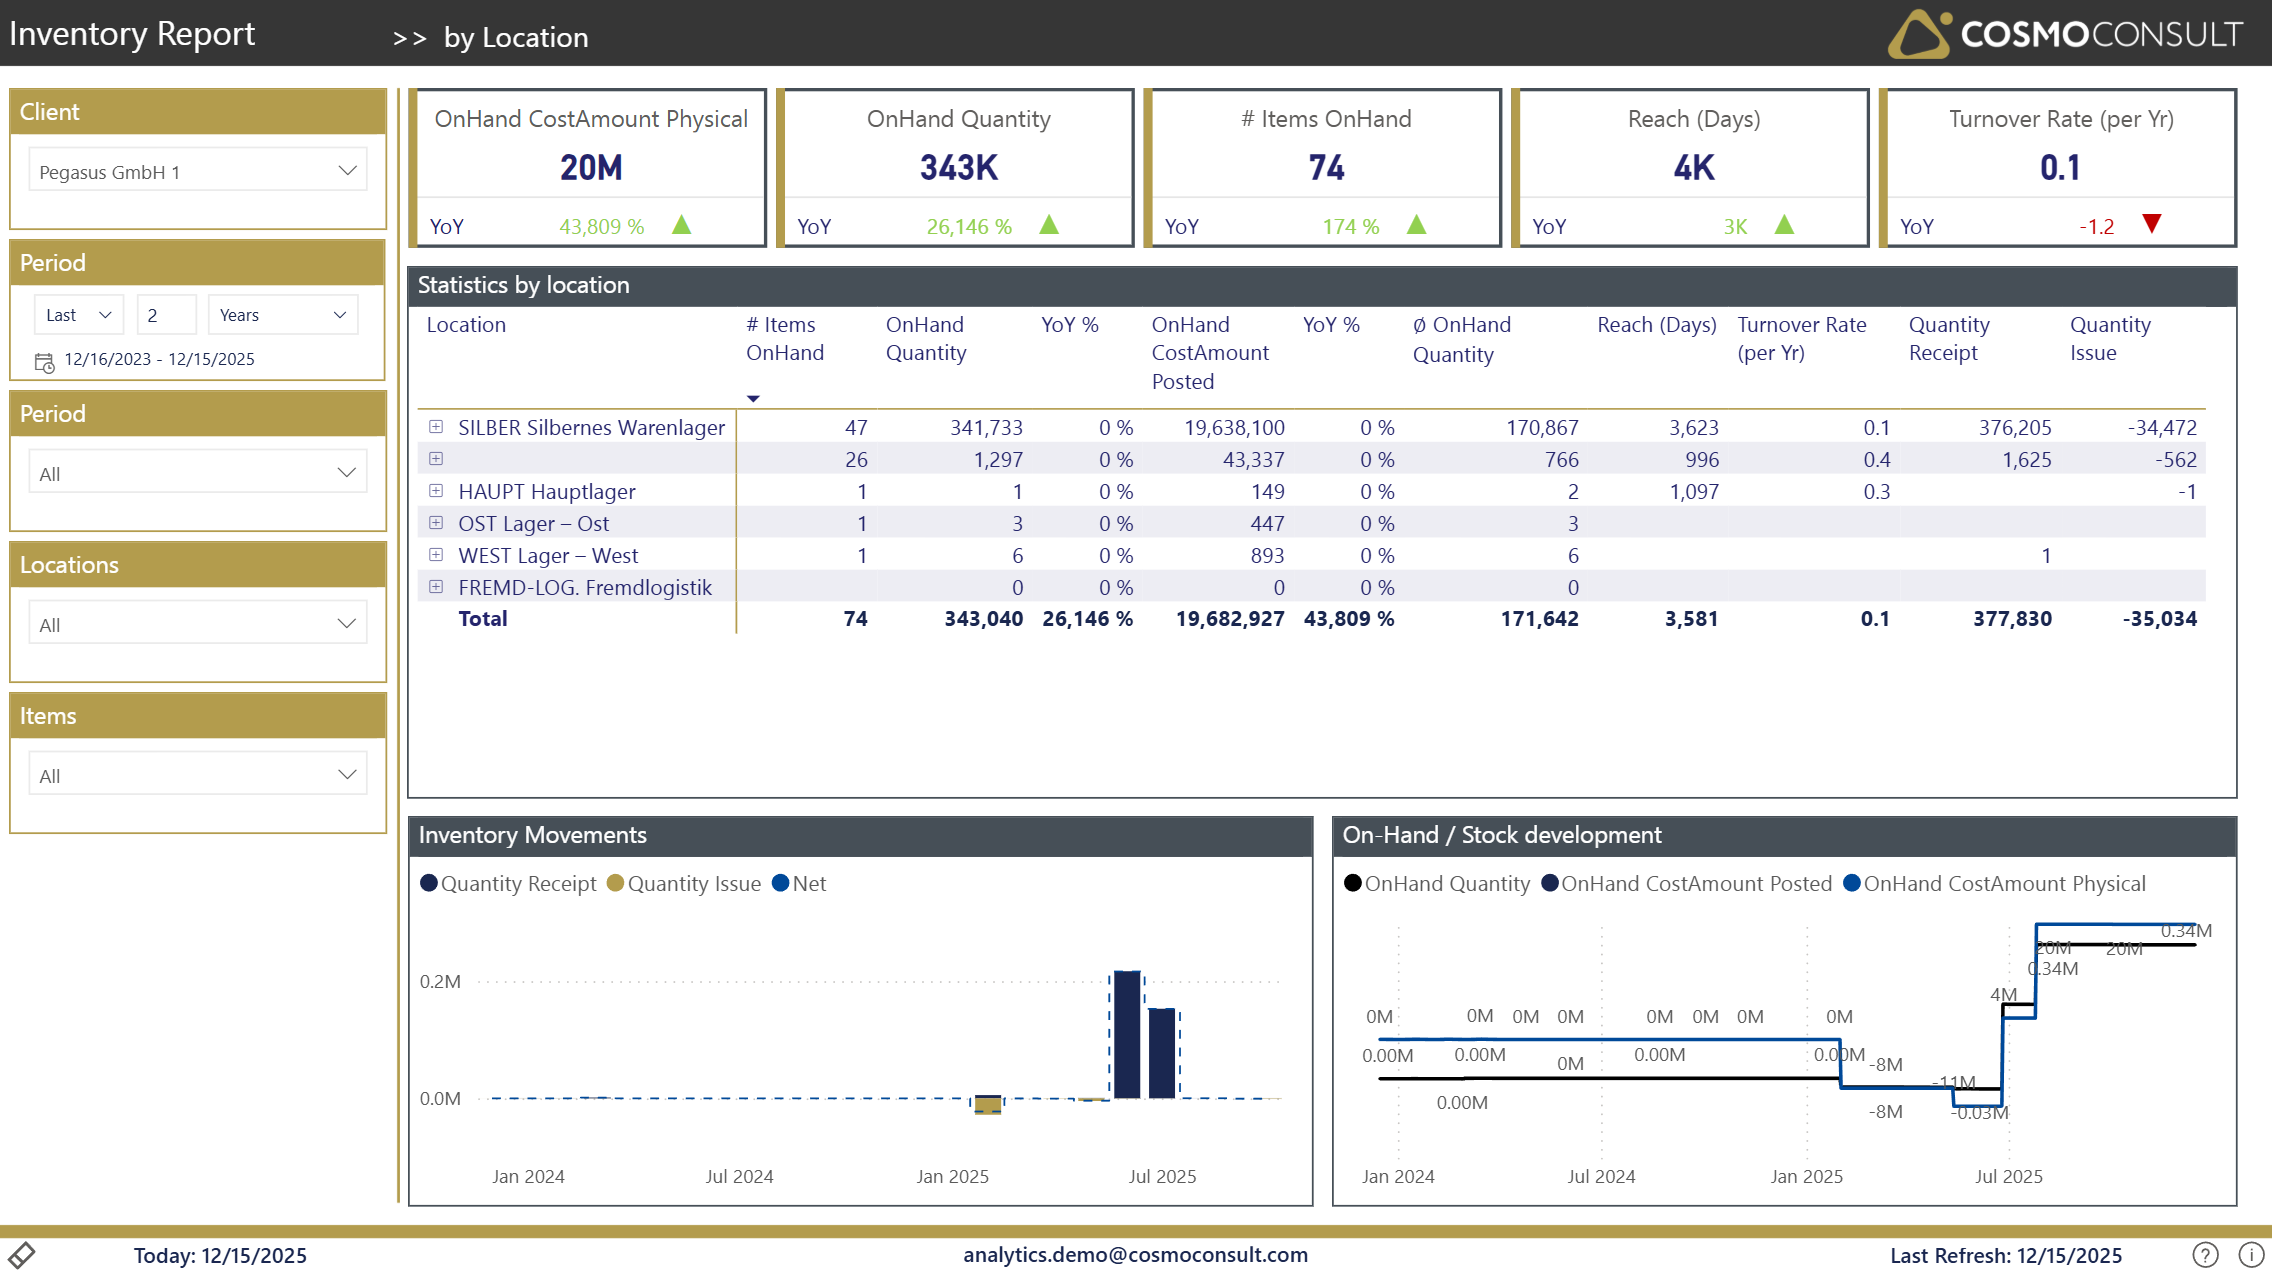
Location Summary Table
The main table displays key metrics for each location:
- Location Code & Description: Warehouse or site identification
- OnHand Quantity: Current stock levels at each location
- OnHand Cost Amount: Total inventory value at each location
- Quantity Issue: Items issued from the location in the selected period
- Quantity Receipt: Items received at the location in the selected period
- Reach (Days): Days of stock coverage based on current usage
- Turnover Rate: Inventory turnover performance per location
Location Performance Metrics
Key performance indicators by location:
- Stock Levels: Current inventory quantities and values
- Inventory Movement: Receipt and issue volumes
- Inventory Efficiency: Turnover rates and reach days
- Capital Distribution: How inventory value is distributed across locations
Interactive Features
- Drill-down capability: Click on a location to filter all visuals
- Cross-filtering: Select items to see their distribution across locations
- Sorting: Sort by any column to identify top/bottom performers
- Tooltips: Hover over data points for additional details
Typical Use Cases
Stock Distribution Analysis
Identify locations with excess stock or potential stock shortages, enabling proactive redistribution decisions.
Location Performance Comparison
Compare turnover rates and efficiency metrics across locations to identify best practices and areas for improvement.
Cost Optimization
Analyze inventory value distribution to optimize working capital allocation across the location network.