Item Analysis
The Item Analysis page provides detailed insights about inventory movements and stock levels for specific items, enabling validation of ledger entries and analysis of statistical lead times for procurement processes.
Overview
This page helps you:
- Analyze detailed item ledger entries and validate transactions
- Calculate and review statistical lead times for procurement
- Monitor inventory movements at the transaction level
- Identify patterns in receipt and issue transactions
Filters
Standard filters available for detailed analysis:
- Client Selection: Choose the client for multi-tenant scenarios
- Period Selection: Set the date range for your analysis
- Location: Filter by specific warehouses or distribution centers
- Item Selection: Focus on specific items for detailed analysis
Key Visualizations
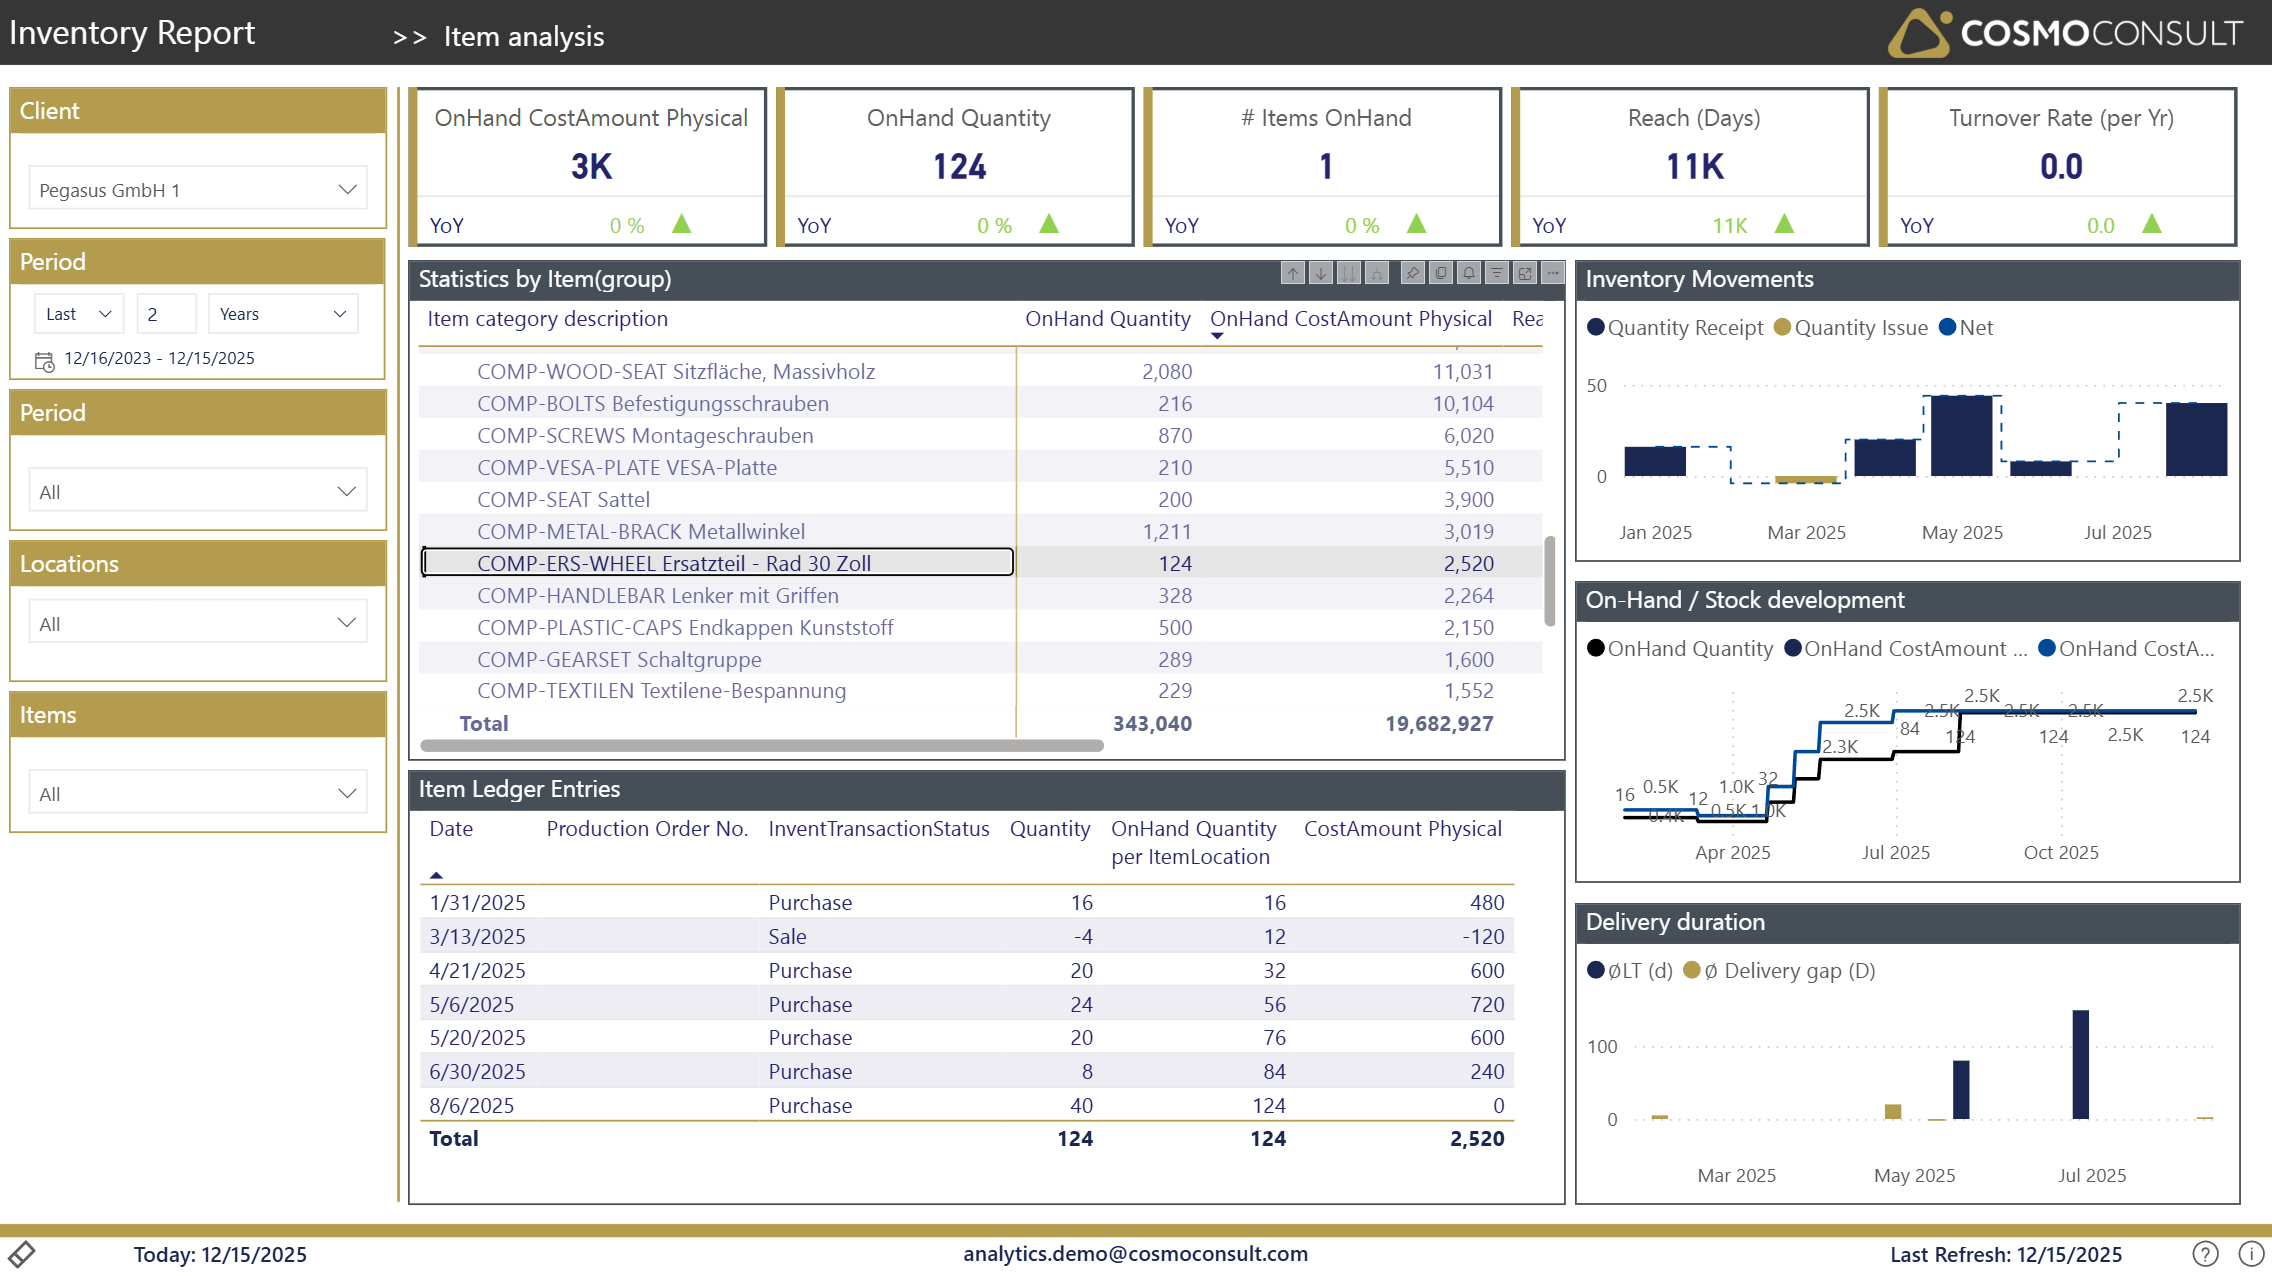
Item & Category Selection Table
Use the table showing items and item categories for interactive filtering of the detailed ledger entries:
- Item Number & Description: Product identification
- Item Category: Product grouping
- OnHand Quantity: Current stock level
- OnHand Cost Amount: Current inventory value
- Reach (Days): Estimated days of inventory remaining based on average usage
Click on items in this table to filter all other visuals on the page.
Item Ledger Entries Table
Detailed transaction-level view of all inventory movements:
- Posting Date: When the transaction was recorded
- TransactionStatus: Type of transaction (Purchase, Sale, Positive/Negative Adjustment, Transfer, etc.)
- Quantity: Transaction quantity (positive for receipts, negative for issues)
- OnHand Quantity per ItemLocation: Stock level after the transaction
- Cost Amount Physical: Transaction value
Statistical Lead Time Analysis
Analyze procurement performance:
- Avg LT (d): Average Lead Time in days
- Avg Delivery gap (d): Average gap in days between promised and actual delivery
This analysis helps validate and optimize the lead time parameters maintained in SKU cards.
Use Cases
Transaction Validation
Verify that inventory movements are recorded correctly and investigate any discrepancies or unexpected transactions.
Cost Analysis
Track how cost prices have changed over time and identify cost variance patterns.
Audit Support
Provide detailed transaction history for internal or external audit requirements.
Root Cause Investigation
Drill down into specific items to understand why stock levels or values have changed unexpectedly.