Replenishment Optimization
The Replenishment Optimization page provides advanced analytics for optimizing inventory replenishment parameters based on historical demand patterns, lead times, and target service levels. This page helps identify opportunities to improve SKU parameter settings.
Overview
This page supports data-driven optimization of replenishment parameters by:
- Analyzing historical demand patterns and variability
- Calculating optimal safety stock and reorder points
- Comparing current vs. proposed parameter settings
- Identifying SKUs with suboptimal parameter configurations
- Supporting implementation of improved replenishment strategies
The analysis is based on statistical methods including:
- Demand variability analysis (coefficient of variation)
- Lead time analysis (average, standard deviation)
- Service level calculations
- ABC/XYZ classification integration
Filters
Advanced filtering capabilities for replenishment analysis:
- Client Selection: Choose the client for multi-tenant scenarios
- Period Selection: Set historical analysis timeframe
- Location: Filter by specific warehouses or distribution centers
- Item Selection: Focus on specific items or item groups
- Item Category: Analyze by product category
- ABC/XYZ Classification: Filter by demand classification
- Replenishment System: Filter by procurement method (Purchase, Production, Transfer)
Key Visualizations
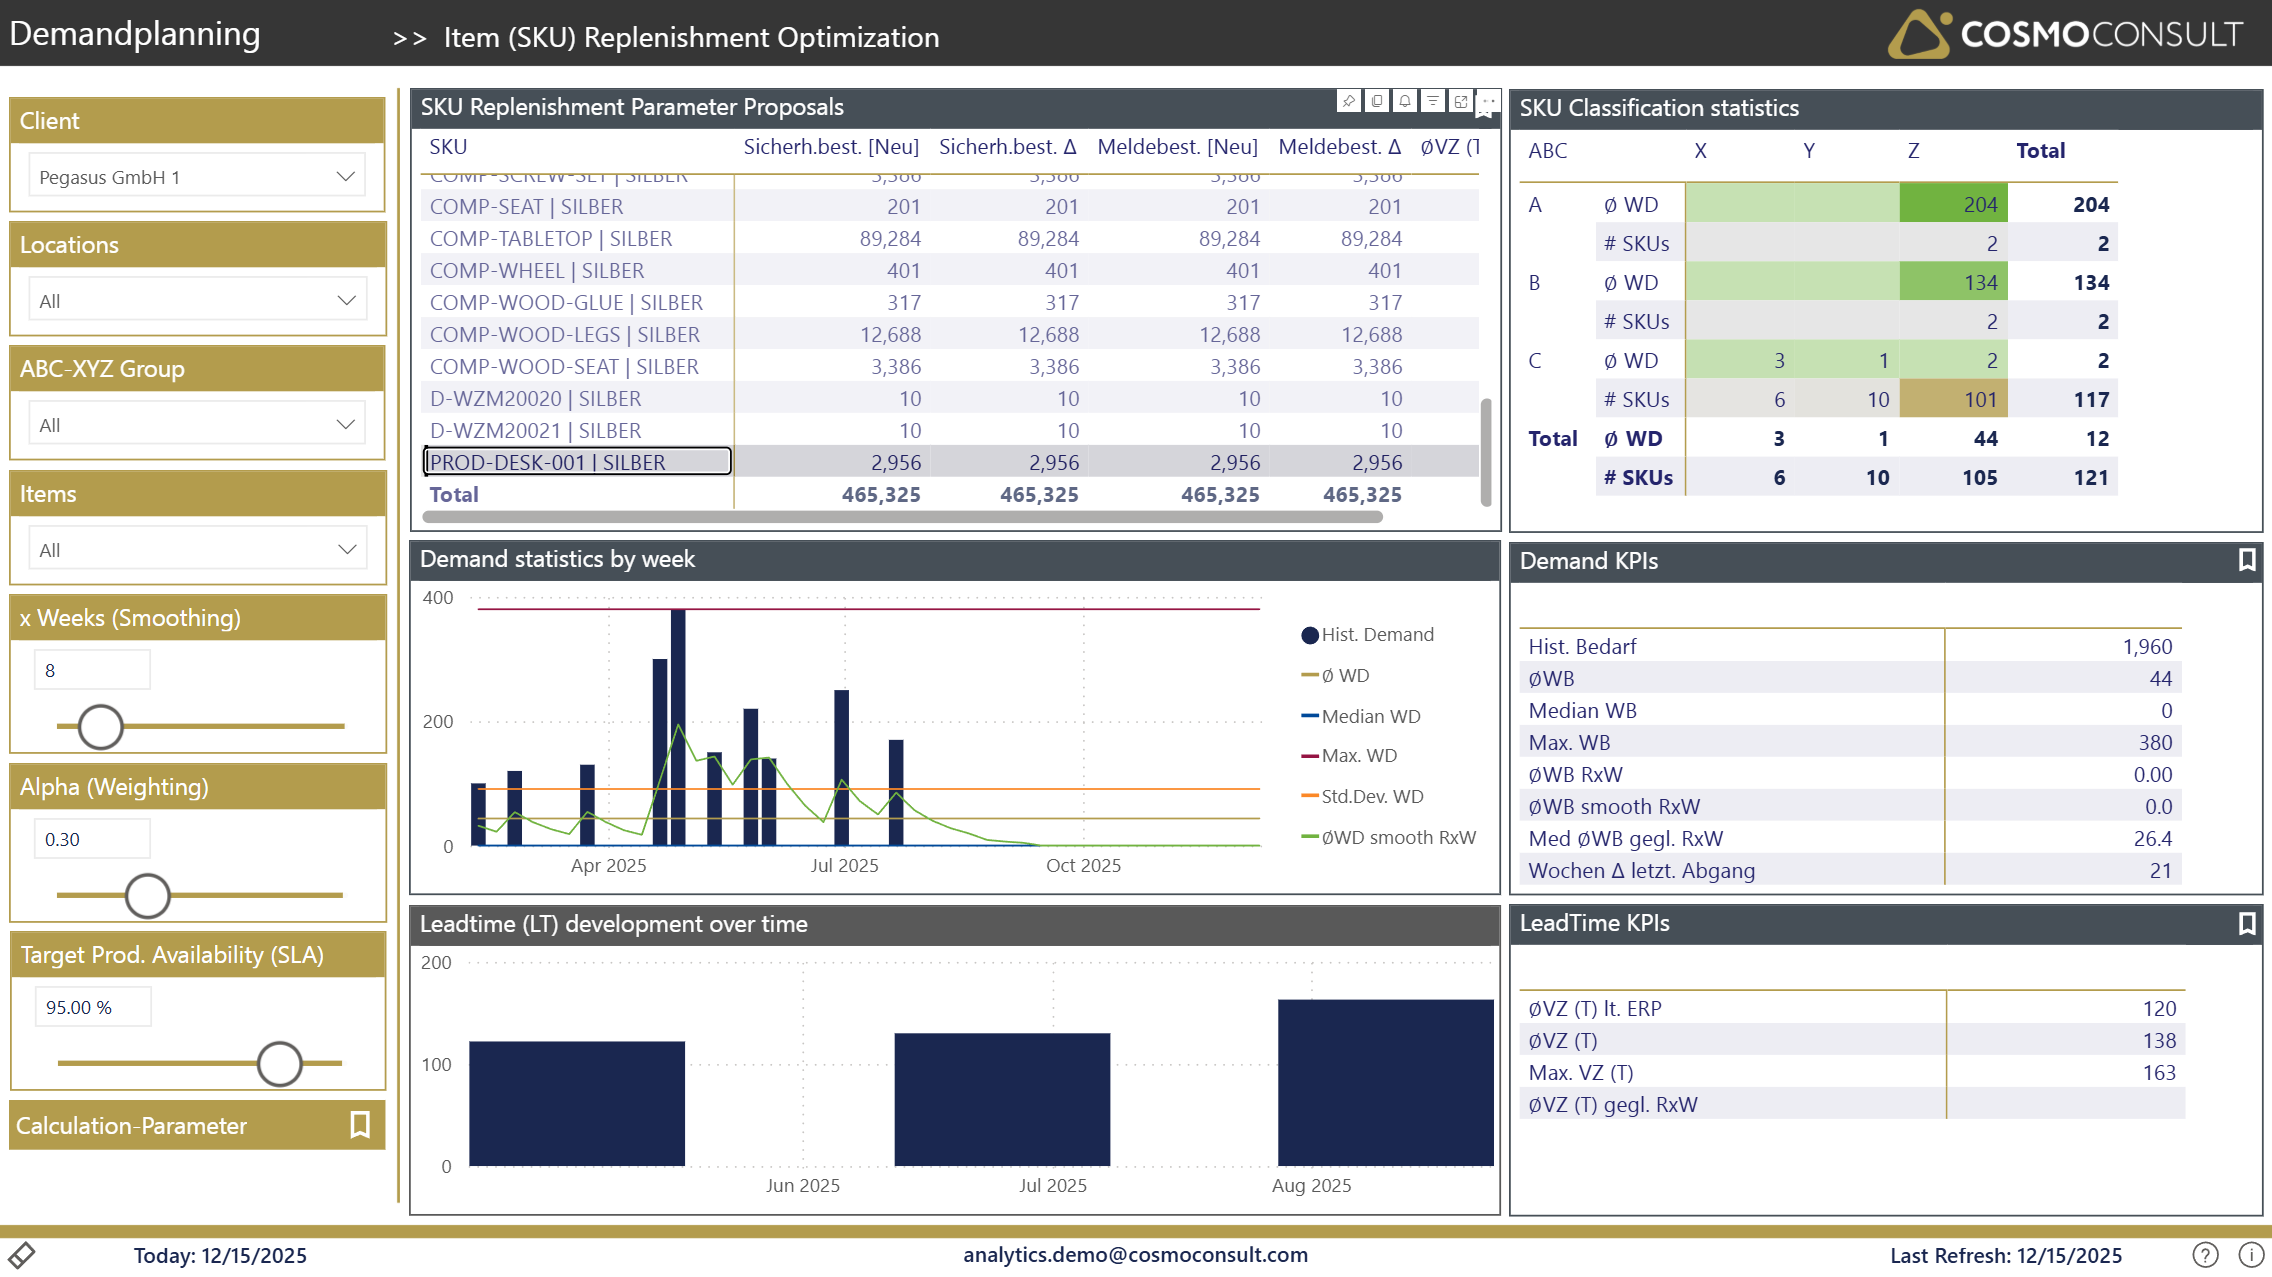
Parameter Comparison Table
Comprehensive view comparing current and proposed parameters:
Proposed Parameters (Calculated):
- Safety Stock Quantity (New)
- Reorder Point (New)
- Lead Time (Used for Calculation)
Deviation Analysis to current ERP Parameters:
- Absolute deviation between current and proposed
Demand Statistics
Historical demand analysis supporting parameter calculations:
- Average Weekly Demand: Mean demand per week
- Median Weekly Demand: Middle value of weekly demand
- Max Weekly Demand: Peak demand week
- Standard Deviation: Demand variability measure
- Coefficient of Variation: Relative variability indicator
Lead Time Analysis
Lead time statistics for supplier/production performance:
- Average Lead Time: Mean procurement/production time
- Min/Max Lead Time: Range of lead time observations
- Lead Time Std. Deviation: Lead time reliability measure
- Statistical Lead Time: Calculated with target confidence level
Service Level Settings
Configure target service levels for calculations:
- Target Item Availability (SLA): Desired in-stock probability
- Safety Factor (Z-Score): Statistical confidence level
Calculation Methods
Safety Stock & Reorder Point Calculation
Safety stock and Reorder Point is calculated using statistical formulas considering:
- Demand variability during lead time
- Lead time variability
- Target service level (z-score)
- Demand and lead time standard deviations
Calculation parameters can be used to specify on XYZ classification which statistical demand function to be used for safety stock calculation. Similar for lead time calculation. By using different methods for different classifications, the optimization can be fine-tuned to each group of items. By using smoothing KPIs in combination with x-Weeks (smoothing) parameter, recent changes in demands or lead times can be better reflected in the calculations.
ABC/XYZ Integration
Classification Influence on Parameters
A-Items (High Value):
- Higher target service levels
- More safety stock to avoid costly stockouts
- Frequent parameter reviews
B-Items (Medium Value):
- Balanced service levels
- Moderate safety stock
- Regular parameter reviews
C-Items (Low Value):
- Lower service levels acceptable
- Minimal safety stock
- Less frequent reviews
X-Items (Stable Demand):
- Statistical methods work well
- Lower safety stock multipliers
- Predictable replenishment
Y-Items (Moderate Variation):
- Moderate safety stock
- Standard statistical methods
- Regular monitoring
Z-Items (High Variation):
- Higher safety stock multipliers
- Special attention needed
- Alternative strategies may be required
Use Cases
Safety Stock Optimization
Identify items where safety stock can be reduced without compromising service levels, or where increases are needed to prevent stockouts.
Service Level Alignment
Ensure replenishment parameters align with target service level objectives for different item classifications.
Working Capital Reduction
Optimize inventory investment by right-sizing safety stock based on actual demand patterns and lead times.
Parameter Maintenance
Establish a systematic process for reviewing and updating SKU parameters based on changing demand patterns.