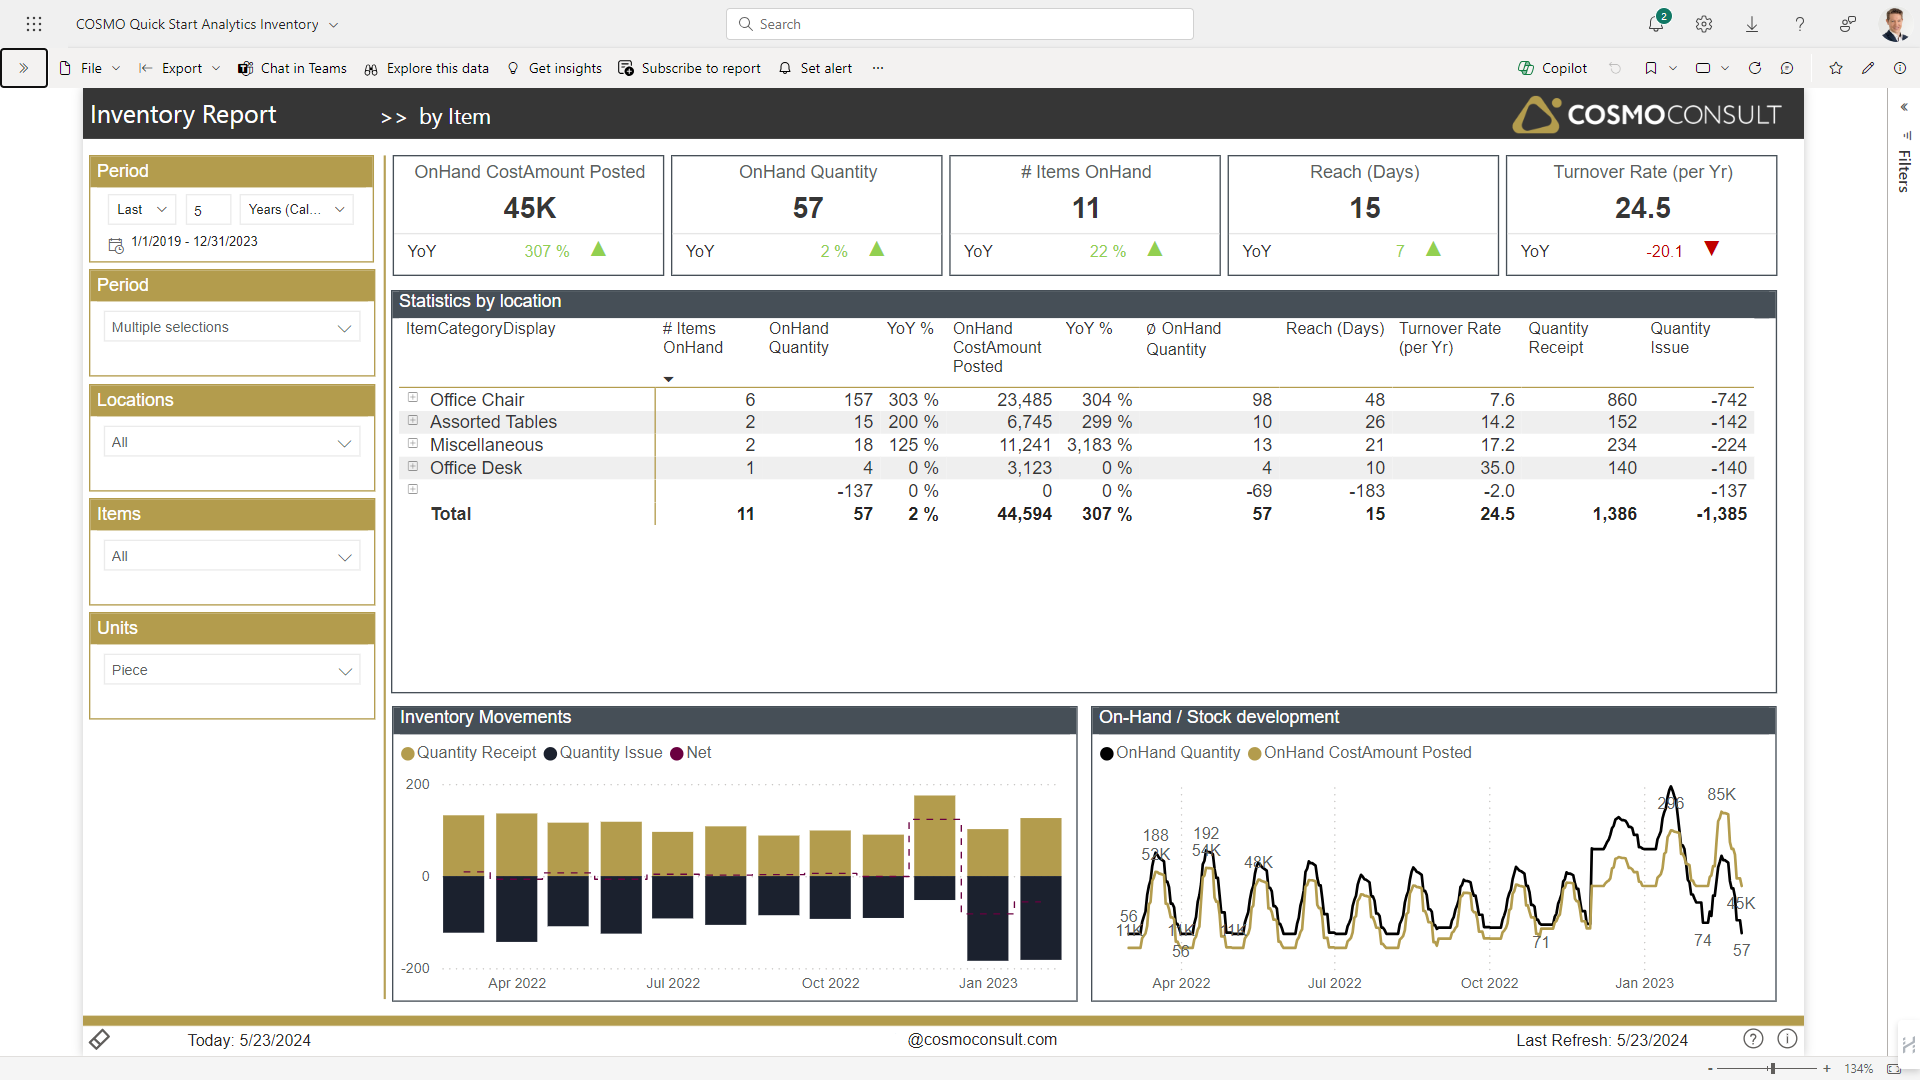
Item Movements
In the visualization area of the by Item report page, you see additional details by Item (or aggregated by Item Groups).
For example, you can
- use the column header Reach (Days) (sort by descending values) to detect items with the highest reach in order to identify overstockings.
- select specific items to see the supply-chain pattern in the charts below.