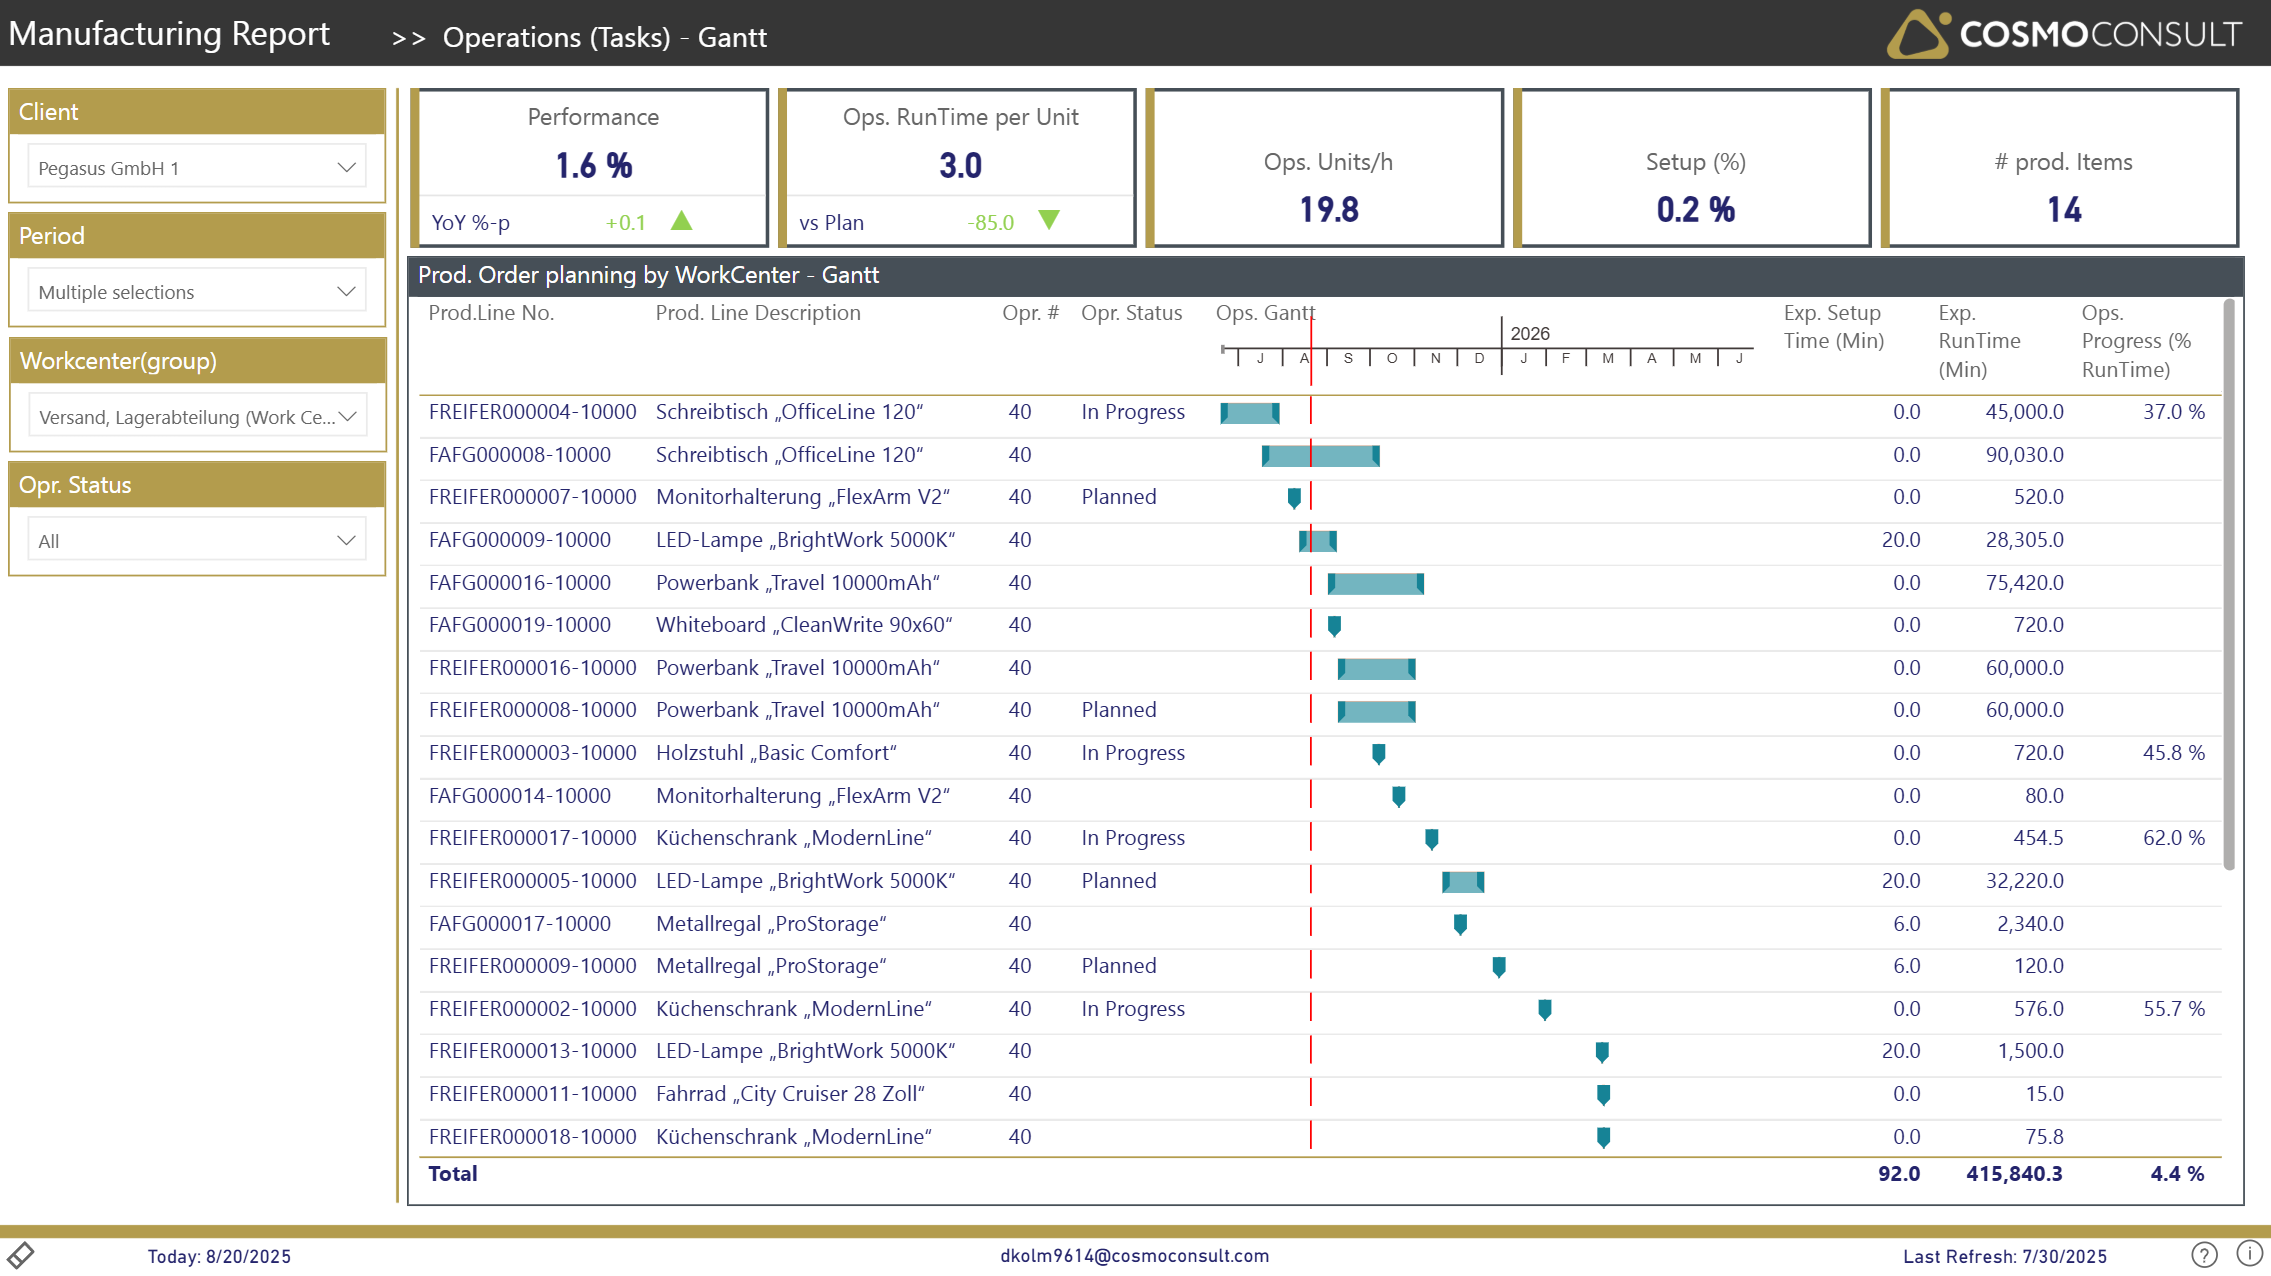
Operations (Tasks) - Gantt
by filtering on a single Workcenter using the slicer, you can display all historic/current/upcoming production tasks on this work center. The view is sorted by startdate to easily get an overview about the status/progress of respective tasks.
This chart can be used, to analyze the number of changes in products manufactured on a specific work-center, which might come along with high setup-times. A KPI at the top indicates the share of setup-time vs. run-time to identify overall un-productive times.