Summary
COSMO Analytics Quick Start Standard Report pages are usually divided into five sections:
- the header (black area)
- the footer (white area at the bottom)
- the filter section on the left hand side
- the KPI area on top of the visualization area
- the visualization core area
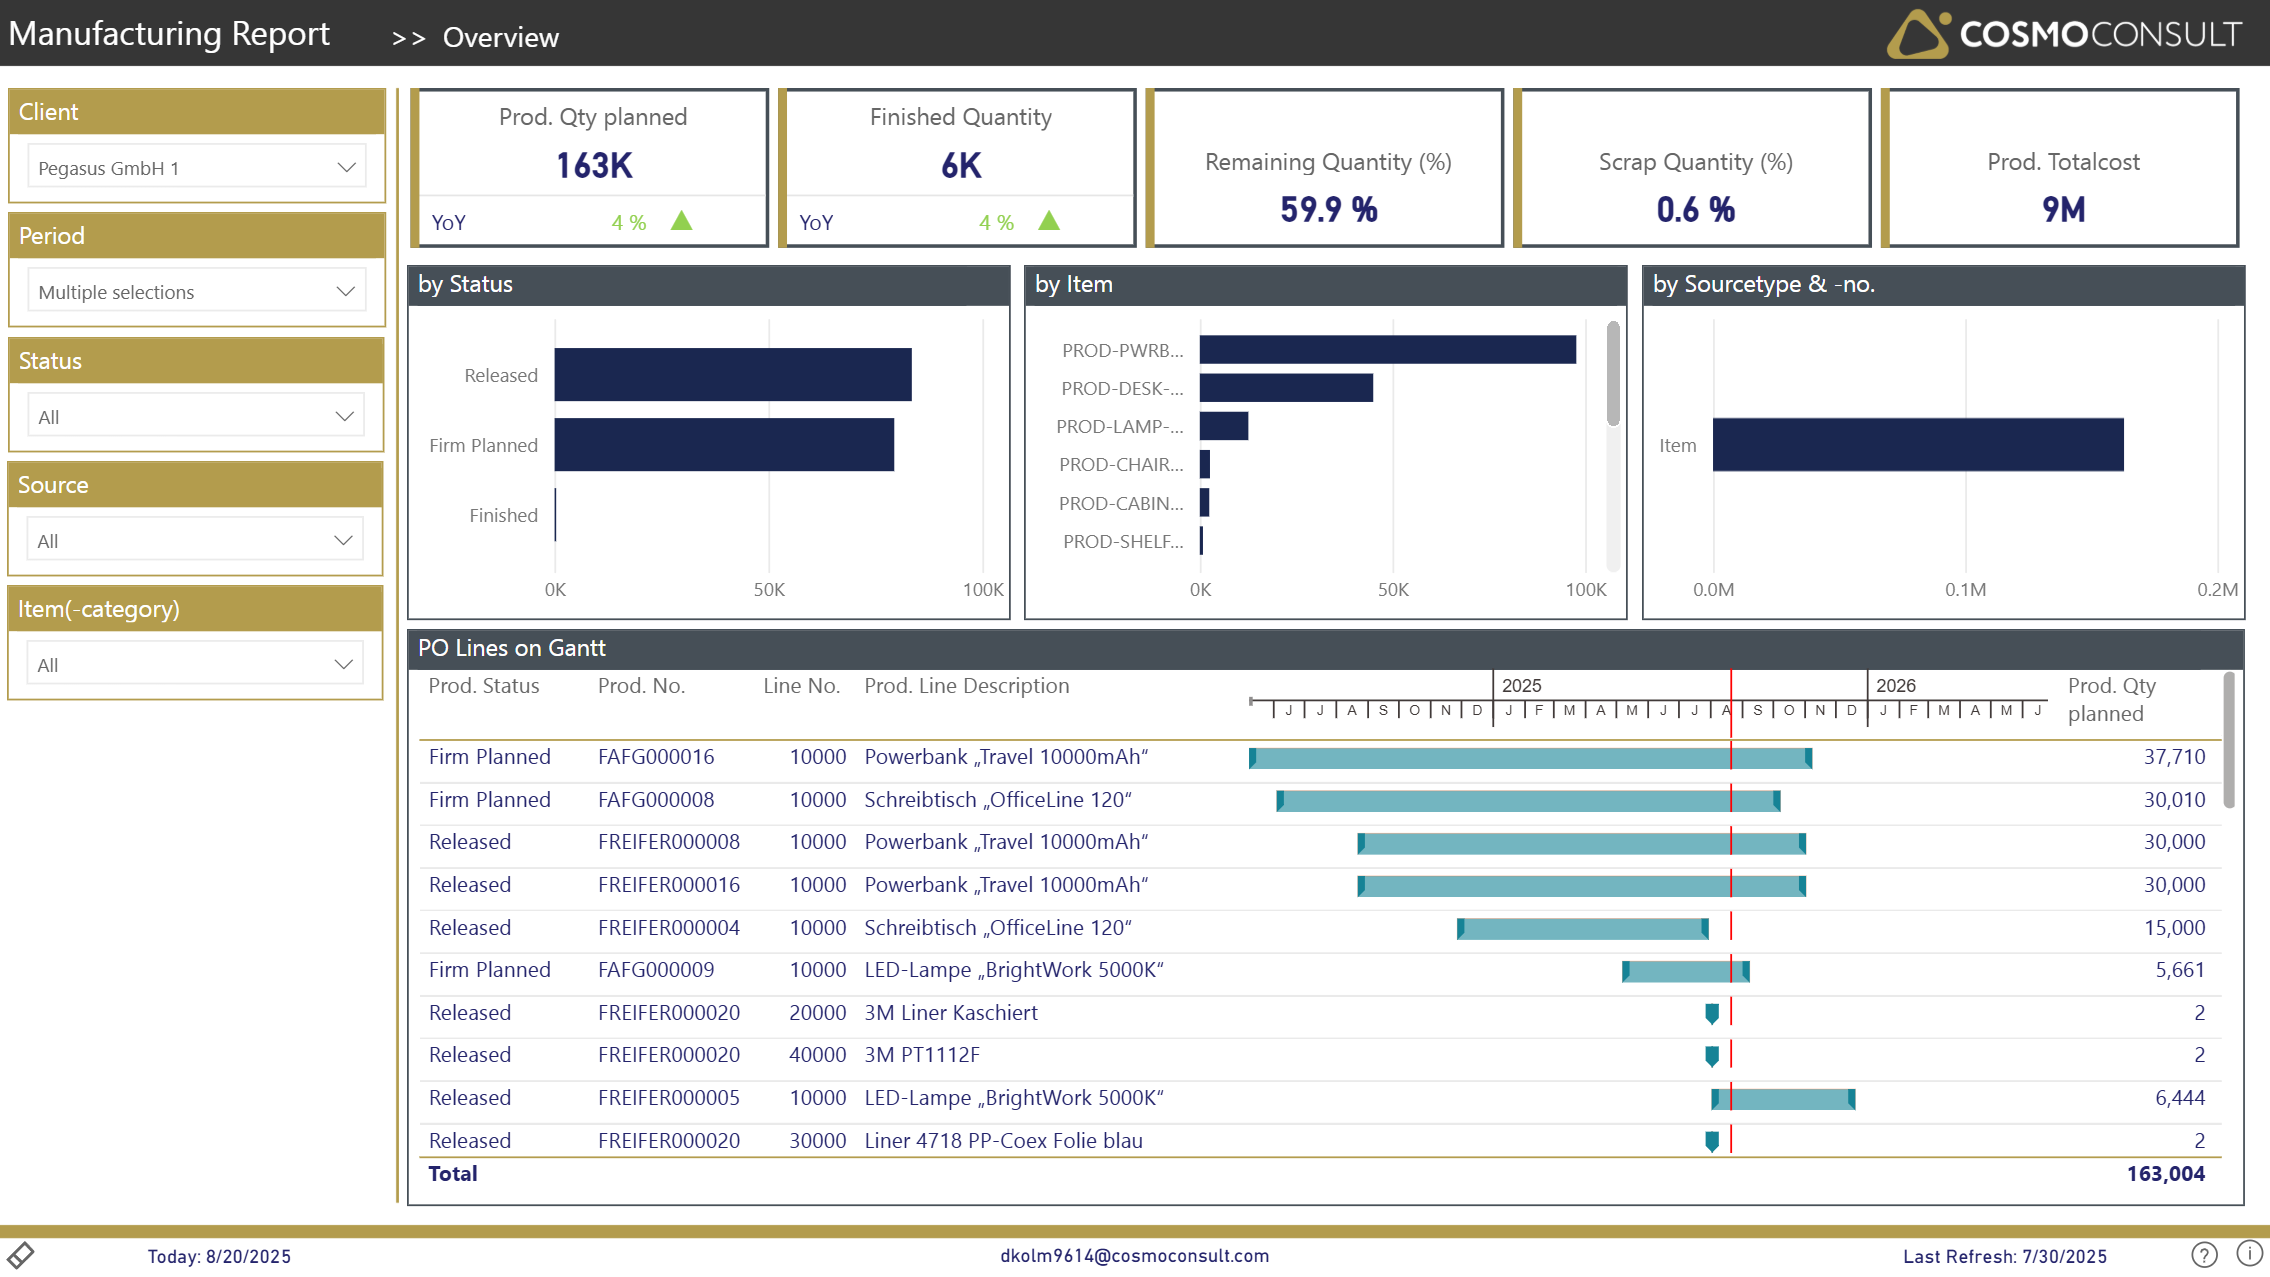
On the Overview page, you see a general summary of
- the most important KPIs
- an overview of planned production quantities by status, item and sourcetype/-no, which can be used to filter the data in the table below
- a high level overview of production orders according to filtered status on a gantt time-axis, sorted by start date
Based on this, various drill-throughs can be used to dig into details on a production order level (e.g. Scrap, Consumption, Ledger, etc.) and the tool-tip shows the key statistic of most important cost deviations.