Purchase Report – By Employee
The By Employee page analyzes purchasing by responsible employee (e.g., buyer or purchaser). It helps management understand how purchasing activity, spend, and discounts are distributed across the team.
Overview
This page focuses on business questions around roles and responsibilities in purchasing:
- Understand who drives purchasing activity – See which employees handle the largest purchase amounts and quantities in the selected period.
- Compare discount behavior across employees – Analyze how discount percentages relate to purchase amounts to support coaching and policy compliance.
- Assess purchasing patterns per employee – Use average purchase amounts over time to understand whether employees place many small orders or fewer large ones.
- Support performance and process discussions – Provide data-driven input for reviewing responsibilities, training needs, and process improvements.
Filters
The left-hand filter panel defines the context for all visuals on this page:
- Client – Selects the D365 BC company/tenant.
- Period (relative) – Sets a relative time frame (e.g., Last 5 Years) and shows the corresponding date range.
- Period (year) – Focuses the analysis on a specific calendar year (e.g., 2023).
- Document Type – Filters the data by purchase document type (e.g., Invoice).
- Employee – Filters by responsible employee/purchaser.
- Items – Restricts the analysis to purchases of selected items.
- Vendor – Restricts the analysis to selected vendors.
Key Visualizations
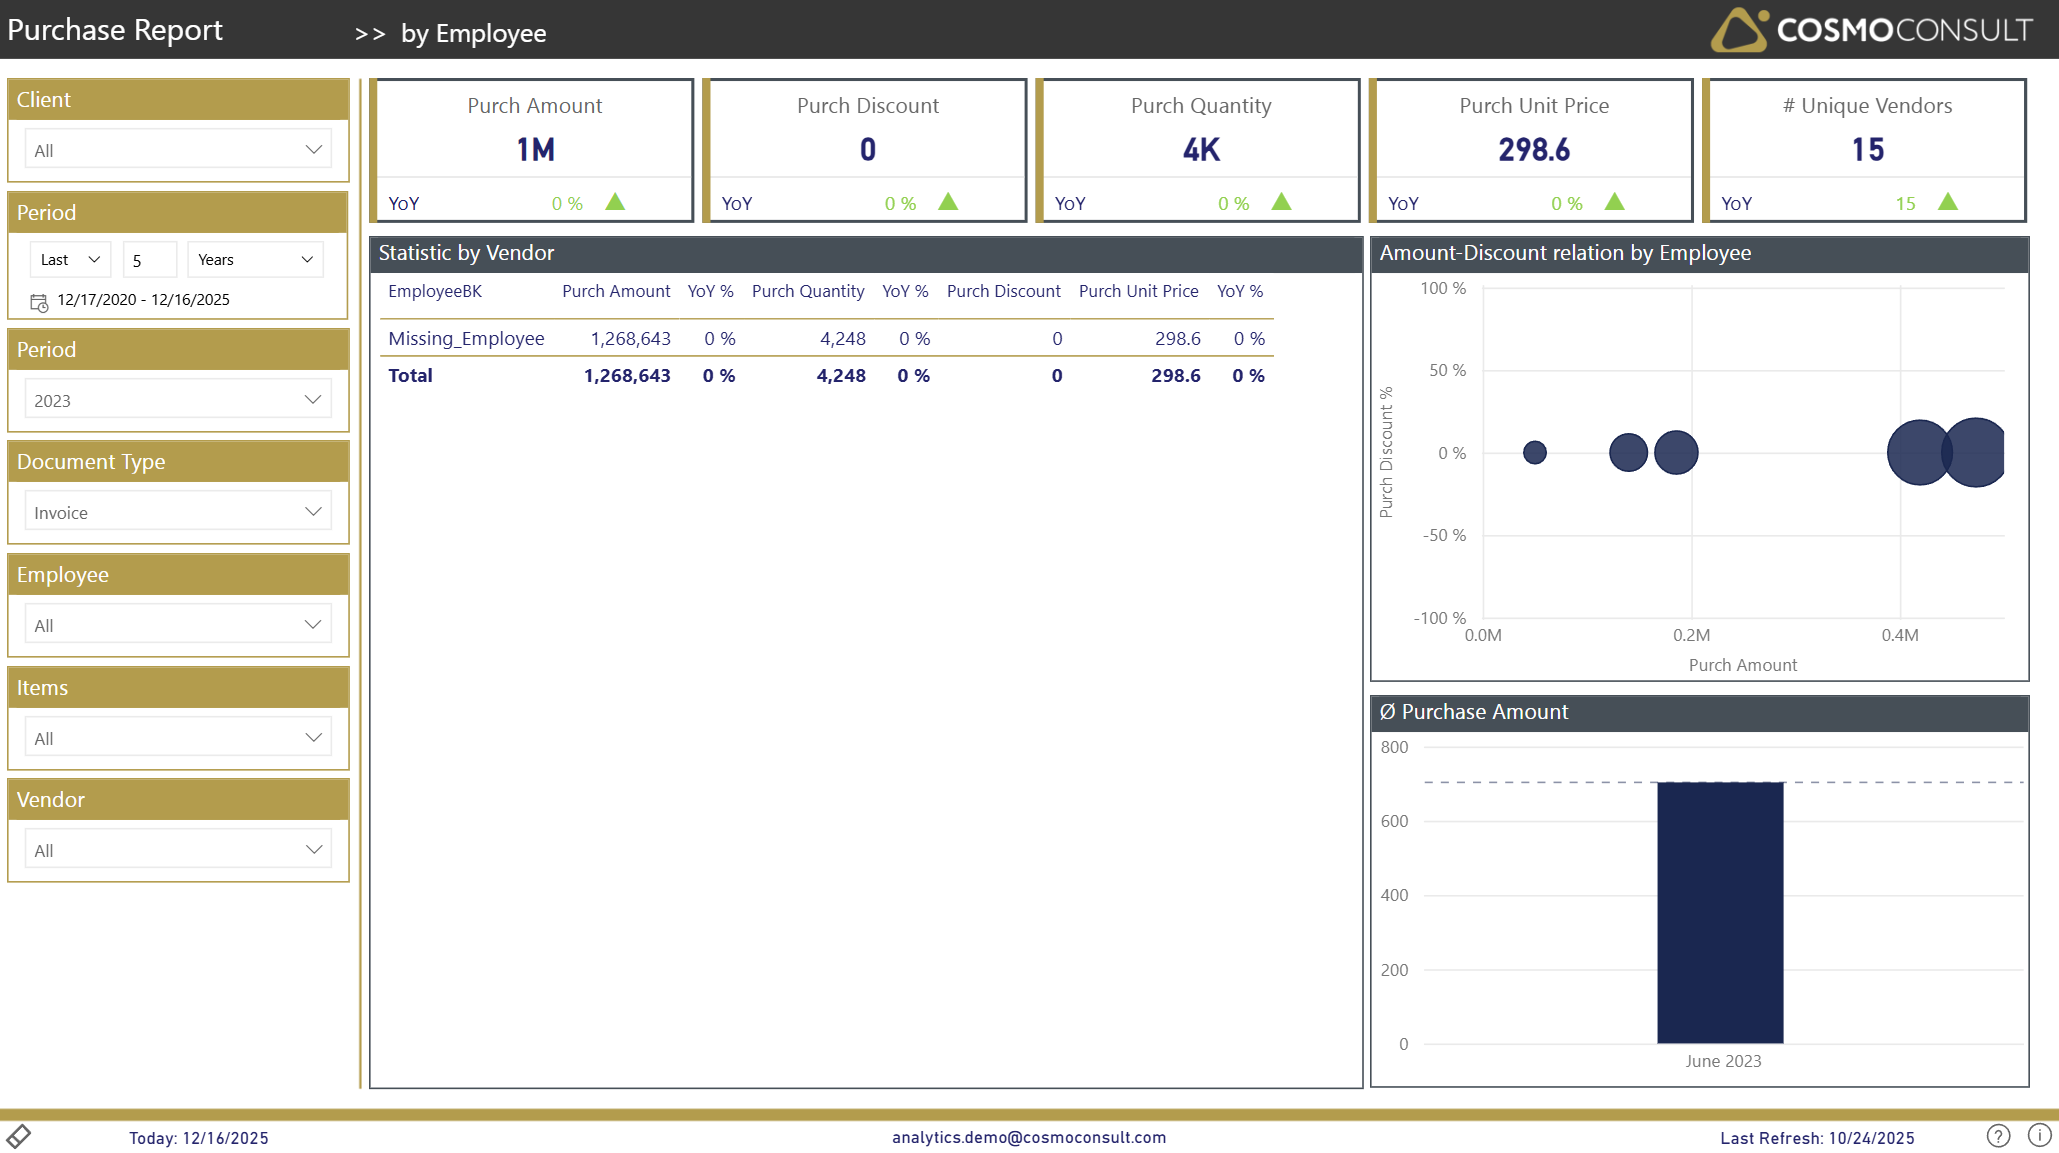
KPI Summary Tiles
Top-row tiles summarize overall purchasing activity for the selected employees and filters:
- Purch Amount – total net purchase amount.
- Purch Discount – total purchasing discounts granted.
- Purch Quantity – total quantity purchased.
- Purch Unit Price – average unit price across all purchases.
- # Unique Vendors – number of vendors involved in purchases for the selected context.
YoY indicators on each tile highlight how team-level purchasing has developed compared to the prior year.
Statistic by Employee (Detail Table)
Table aggregating purchasing metrics per employee, with columns such as:
- EmployeeBK – employee identifier.
- Purch Amount – net purchase amount.
- YoY % – year-over-year change of Purch Amount.
- Purch Quantity – total quantity purchased.
- YoY % – year-over-year change of Purch Quantity.
- Purch Discount – total discounts granted.
- Purch Unit Price – average purchase price per unit.
Use this table to:
- Identify employees with the highest purchase volumes.
- Compare YoY development per employee.
- Provide transparent figures for performance and responsibility discussions.
Amount–Discount Relation by Employee (Scatter)
Scatter chart showing the relationship between purchase amounts and discount levels per employee:
- X-axis: Purch Amount.
- Y-axis: Purch Discount %.
- Bubbles: Employees (bubble size reflects relative importance).
This visual helps you:
- Compare discount behavior across employees at a glance.
- Spot outliers where discount percentages are unusually high or low relative to spend.
Ø Purchase Amount (Average Purchase Amount)
Column chart showing average purchase amount over time for the current selection.
Use this chart to:
- Evaluate whether employees tend to place larger or smaller purchases on average.
- Identify periods with atypically high or low average purchase amounts.
Interactive Capabilities
- Employee focus: Select an employee via slicer or directly in the table to filter all visuals and KPIs to that employee.
- Scatter selection: Click a bubble in the Amount–Discount relation chart to highlight that employee’s figures in the table and average-amount chart.
- Slicer interaction: All slicers (Client, Period, Document Type, Employee, Items, Vendor) immediately recalculate all visuals.
- Sorting & tooltips: Sort the employee table by any column and hover over bubbles or bars to see exact values (e.g., Purch Amount, Discount %, period).
Typical Use Cases
Team Responsibility & Workload Overview
Use the employee table to understand which team members manage the most purchase volume and how this is distributed across the organization.
Discount Policy & Negotiation Quality
Analyze Purch Discount % in combination with purchase amounts to identify employees who may need guidance on discount and negotiation practices.
Process and Efficiency Optimization
Use the average purchase amount view to detect patterns such as many small orders vs. consolidated purchasing, and derive actions to streamline purchasing processes.