Purchase Report – by Item
The By Item page provides a product-centric view of your purchasing. It helps buyers, controllers, and product managers understand which items and item categories drive spend and how price and volume behavior changes over time.
Overview
This page focuses on business questions around items and product groups:
- Identify top-spend products quickly – See which items and categories account for the largest share of purchasing for the selected period and document type.
- Understand price and discount behavior per item – Analyze average purchase prices and discounts at item level to support negotiation and pricing decisions.
- Detect shifts in product mix – Compare current and prior-year purchasing by category and item to see which product groups are growing, stable, or declining.
- Prioritize portfolio actions – Use the detailed item view to identify products that may require renegotiation, substitution, or discontinuation.
- Identify Vendor Dependencies – Link items to their respective vendors to assess supplier concentration risks for key products.
Filters
The left-hand filter panel defines the context for all visuals on this page:
- Client – Selects the D365 BC company/tenant.
- Period (relative) – Sets a relative time frame (e.g., Last 5 Years) and shows the corresponding date range.
- Period (year) – Focuses the analysis on a specific calendar year (e.g., 2023).
- Document Type – Filters the data by purchase document type (e.g., Invoice).
- Employee – Filters by responsible employee/purchaser.
- Items – Restricts the analysis to selected items.
- Vendor – Restricts the analysis to selected vendors.
Key Visualizations
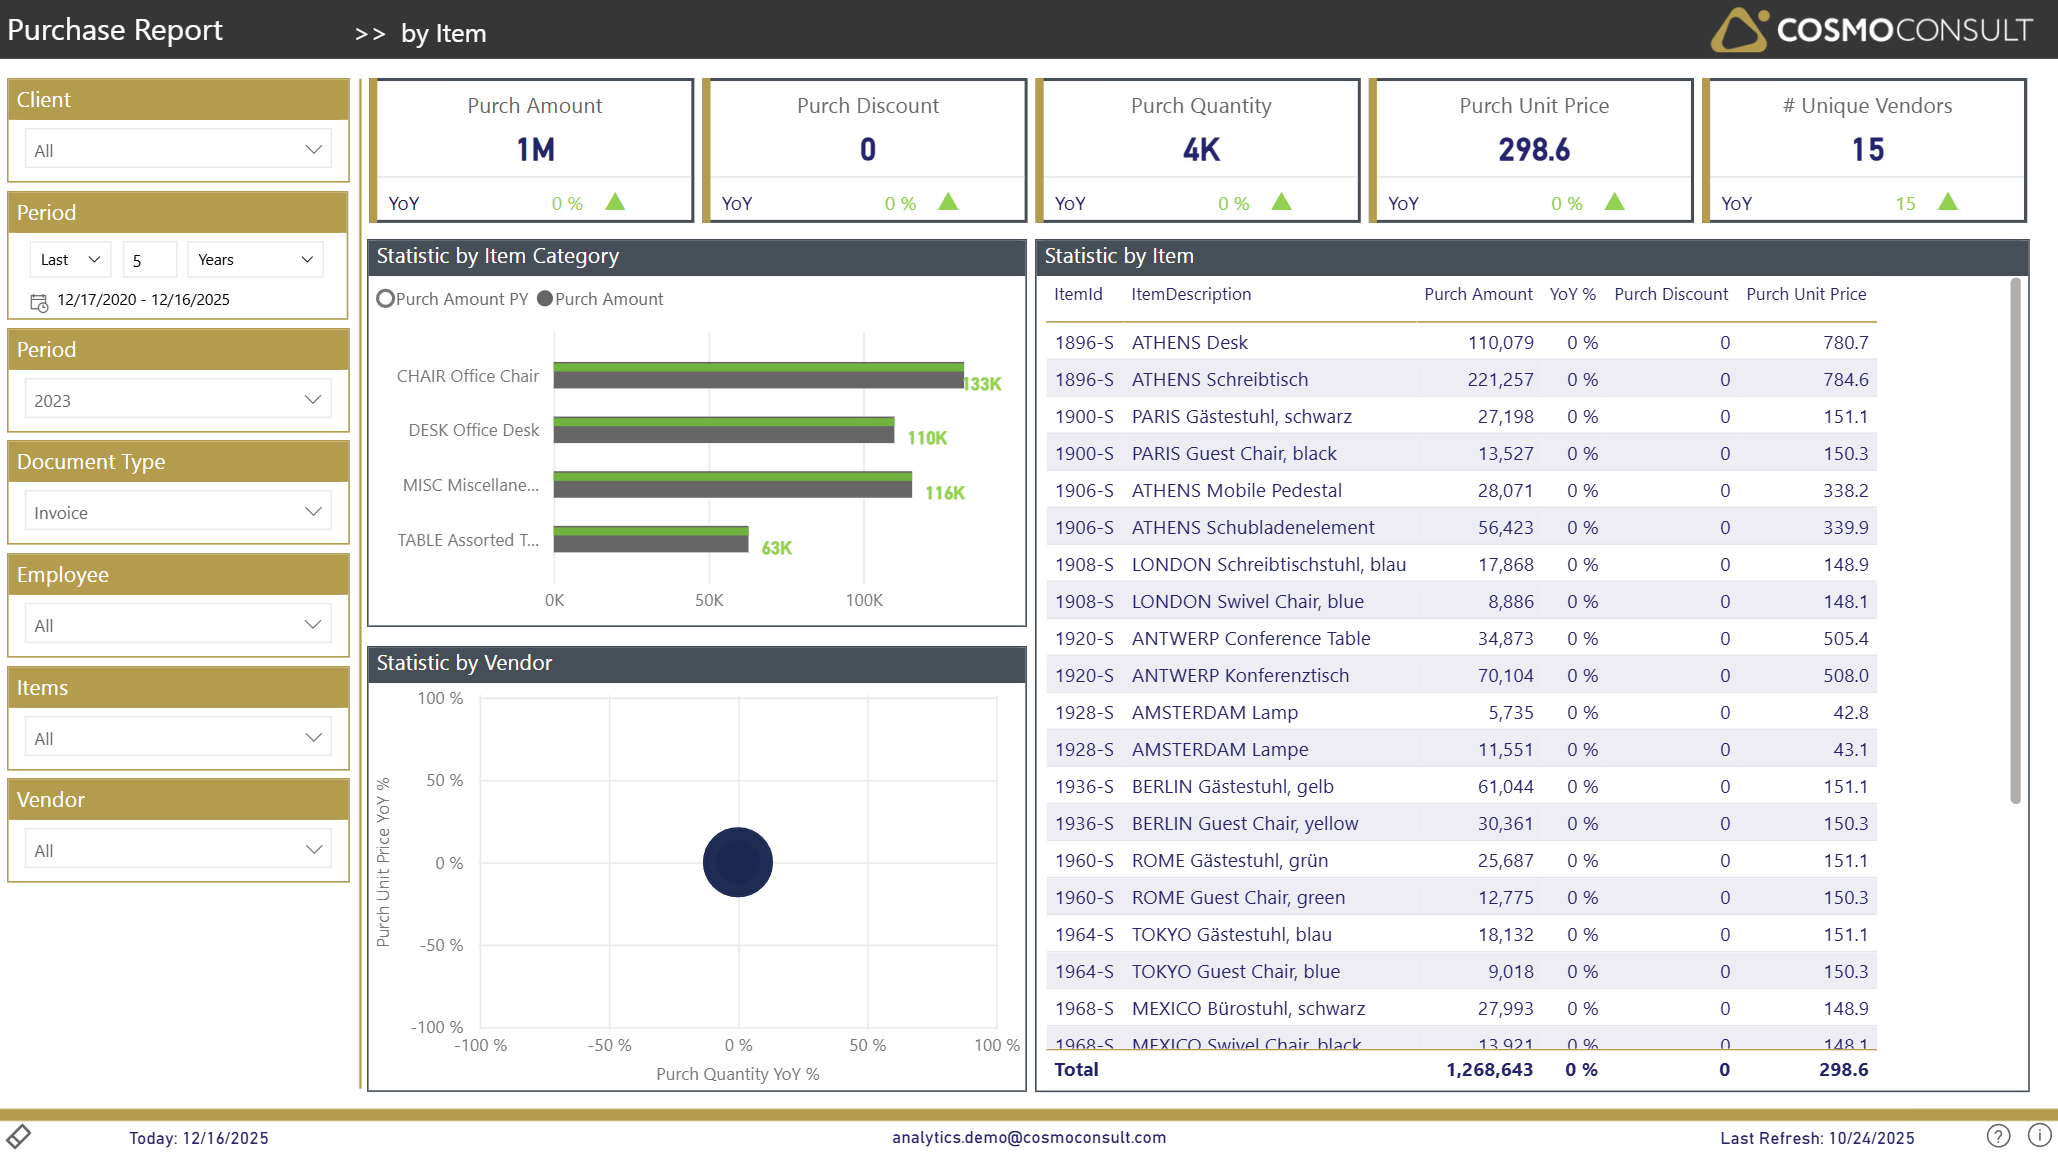
KPI Summary Tiles
Top-row tiles show the main purchasing indicators for the currently selected items and filters:
- Purch Amount – total net purchase amount.
- Purch Discount – total purchasing discounts granted.
- Purch Quantity – total quantity purchased.
- Purch Unit Price – average unit price across all purchases.
- # Unique Vendors – number of active vendors supplying the selected items.
Each tile includes a YoY (Year-over-Year) indicator so you can immediately see how the current value compares to the previous year.
Statistic by Item Category
Horizontal bar chart summarizing item categories:
- Shows Purch Amount and Purch Amount PY per item category.
This view helps you:
- See which categories dominate overall spend for the selected period.
- Compare current-year vs. prior-year purchasing per category to detect category shifts.
Statistic by Item (Detail Table)
Detailed item table listing all relevant items in the selection with columns such as:
- ItemId and ItemDescription – product identification.
- Purch Amount – net purchase amount per item.
- YoY % – year-over-year change of Purch Amount.
- Purch Discount – total discount amount per item.
- Purch Unit Price – average purchase price per unit.
Use this table to:
- Rank items by spend, discount, or price level.
- Spot items with strong growth or decline versus last year.
- Prepare item-specific insights for negotiations or portfolio reviews.
- Cross-filter with the vendor scatter chart to identify which suppliers provide the selected items.
Statistic by Vendor (Scatter)
Scatter chart showing vendor behavior for the items in focus:
- X-axis: Purch Quantity YoY % by vendor.
- Y-axis: Purch Unit Price YoY % by vendor.
- Bubbles: Vendors that supply the selected items (bubble size indicates their relative importance).
This visual helps you:
- Link item-level findings to specific suppliers.
- Identify vendors with significant price or volume changes for the items under review.
Interactive Capabilities
- Category-driven drill-in: Click an item category bar to filter the item table and vendor scatter chart to that category.
- Item selection: Select one or multiple items in the table to focus all visuals and KPIs on those products.
- Slicer interaction: All slicers (Client, Period, Document Type, Employee, Items, Vendor) instantly recalculate all visuals.
- Cross-filtering: Clicking a bubble in the vendor scatter chart filters the item table and KPIs to the corresponding vendor context.
- Sorting & tooltips: Sort the table by any column and hover over bars or rows to see exact values (e.g., Purch Amount, YoY %, Unit Price).
- Drill-through: Right-click an item in the table to access vendor statistics for a particular item.
Typical Use Cases
Top-Item Spend Analysis
Use the item table and category chart to identify high-spend items and categories, enabling focused cost management efforts.
Price & Discount Review per Item
Analyze Purch Unit Price and Purch Discount at item level to detect products with unfavorable price development or unusual discount patterns.
Category Portfolio Management
Compare current vs. prior-year spend per category to support decisions on expanding, maintaining, or reducing specific product groups.
Supplier-Item Relationship Analysis
Leverage the vendor scatter chart to understand which suppliers are critical for key items, helping to manage supplier risks and negotiation strategies.