Purchase Report – By Vendor
The By Vendor page offers a supplier-centric view of your purchasing. It supports vendor management and sourcing decisions by combining spend, volume, and geographic information per vendor.
Overview
This page focuses on business questions around your supplier base:
- Identify strategic and key vendors – See which vendors account for the largest share of spend and volumes in the selected period and document type.
- Monitor vendor KPIs over time – Track how amounts, quantities, and average prices develop per vendor to support negotiations and contract reviews.
- Understand regional exposure – Use the geographic view to see where your supplier base is located and how spend is distributed across regions.
- Support sourcing and risk decisions – Combine vendor rankings and geography to identify concentration risks and opportunities for diversification.
Filters
The left-hand filter panel defines the context for all visuals on this page:
- Client – Selects the D365 BC company/tenant.
- Period (relative) – Sets a relative time frame (e.g., Last 5 Years) and shows the corresponding date range.
- Period (year) – Focuses the analysis on a specific calendar year (e.g., 2023).
- Document Type – Filters the data by purchase document type (e.g., Invoice).
- Employee – Filters by responsible employee/purchaser.
- Items – Restricts the analysis to purchases of selected items.
- Vendor – Restricts the analysis to selected vendors.
Key Visualizations
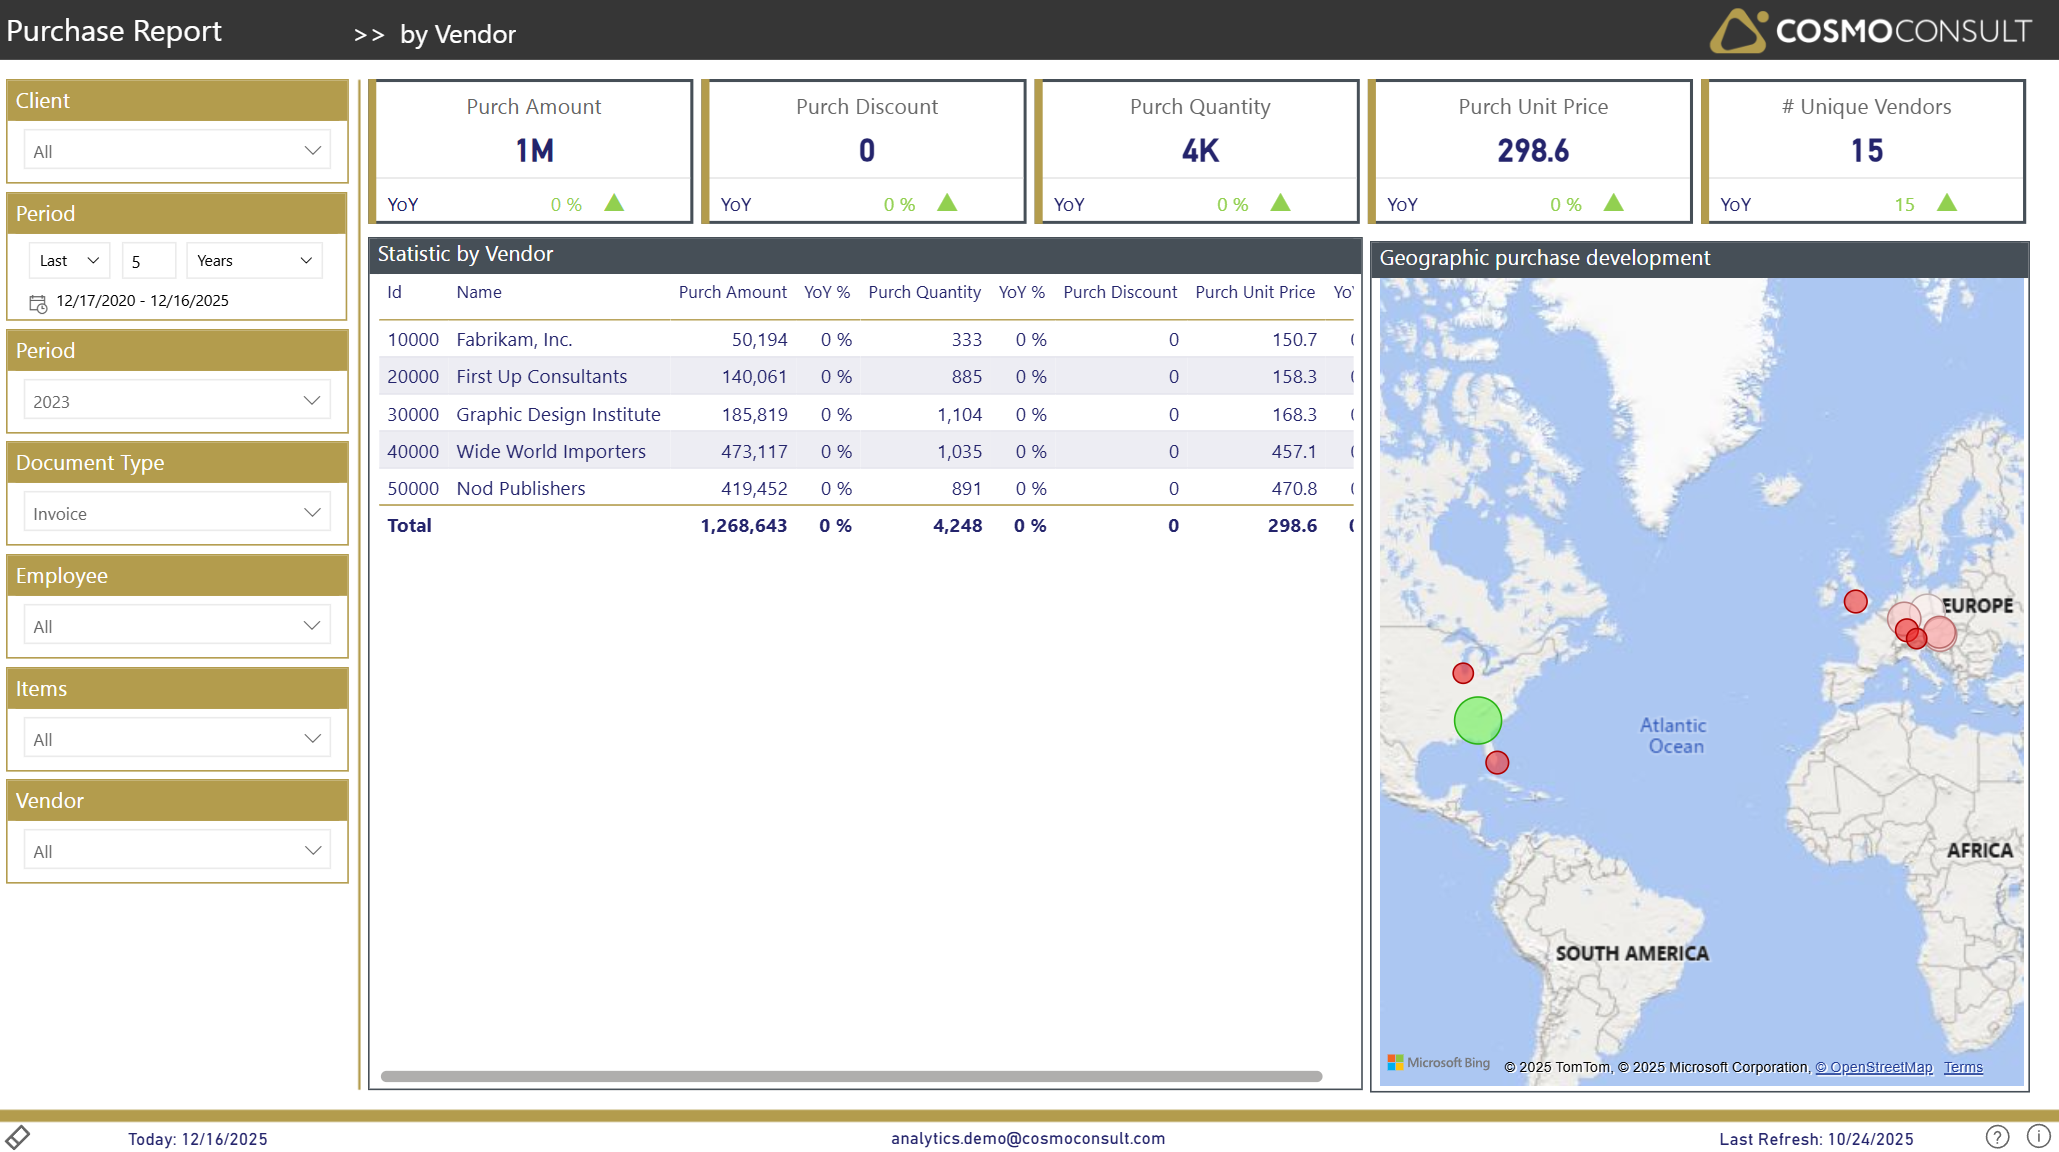
KPI Summary Tiles
Top-row tiles summarize vendor-related purchasing activity for the current context:
- Purch Amount – total net purchase amount across all vendors in scope.
- Purch Discount – total purchasing discounts granted.
- Purch Quantity – total quantity purchased.
- Purch Unit Price – average unit price across all vendors.
- # Unique Vendors – number of active vendors in the selected period.
Each tile includes a YoY indicator so you can see whether vendor-related purchasing is increasing or decreasing compared to last year.
Statistic by Vendor (Detail Table)
Vendor table showing a consolidated view per vendor, with columns such as:
- Id and Name – vendor identification.
- Purch Amount – net spend per vendor.
- YoY % – year-over-year change of Purch Amount.
- Purch Quantity – total quantity purchased from the vendor.
- YoY % – year-over-year change of Purch Quantity.
- Purch Discount – total discounts granted by the vendor.
- Purch Unit Price – average purchase price per unit from the vendor.
Use this table to:
- Rank vendors by spend, quantity, or discount volume.
- Identify vendors with rising prices or shrinking volumes.
- Prepare vendor-specific views for negotiations and supplier reviews.
Geographic Purchase Development (Map)
Map visual showing where your vendors are located:
- Each bubble represents a vendor location.
- Position reflects vendor geography; size/color indicates relative importance.
This visual helps you:
- See geographic clusters of your supplier base.
- Understand regional concentration of purchasing.
- Support decisions around regional sourcing strategies and risk diversification.
Interactive Capabilities
- Vendor selection: Click a vendor row in the table to focus the map and KPI tiles on that vendor.
- Map selection: Select a bubble on the map to filter the vendor table and KPIs to the corresponding location/vendor.
- Slicer interaction: All slicers (Client, Period, Document Type, Employee, Items, Vendor) instantly update both the table and map.
- Sorting & tooltips: Sort the table by Purch Amount, Quantity, or Unit Price and hover over table rows or map bubbles to see exact values and vendor details.
- Drill-Through: Use drill-through to navigate to item details for a deeper analysis of purchased products from a specific vendor.
Typical Use Cases
Strategic Supplier Analysis
Identify key vendors by spend and quantity, and use YoY development to prioritize which suppliers require attention in negotiations or contract reviews.
Vendor Performance & Price Monitoring
Monitor changes in volumes and average prices per vendor over time to detect unfavorable developments or opportunities for better terms.
Geographical Risk & Opportunity Assessment
Use the map to reveal regional concentration of your vendor base and evaluate where you might need alternative suppliers or new sourcing regions.