Purchase Report – Overview
The Overview page delivers a high-level summary of your purchasing situation and trends. It is designed as the starting point for managers and controllers to understand the big picture before moving into detailed analysis on the other pages.
Overview
This page focuses on the overall business questions around purchasing performance:
- Understand overall purchasing health quickly – See in one place how your total purchases, volumes, and supplier base look for the selected period and document type.
- Recognize trends and seasonality – Use the monthly trend to spot recurring peaks, slow periods, or unusual fluctuations in purchasing activity.
- See how spend is distributed – Identify how your purchasing is split across vendors and item categories to understand structural dependencies and concentration risks.
- Identify where to investigate further – Use the high-level views to decide whether you should drill down by product, vendor, or employee on the dedicated pages.
Filters
The left-hand filter panel defines the context for all visuals on this page:
- Client – Selects the D365 BC company/tenant.
- Period (relative) – Sets a relative time frame (e.g., Last 5 Years) and shows the corresponding date range.
- Period (year) – Focuses the analysis on a specific calendar year (e.g., 2023).
- Document Type – Filters the data by purchase document type (e.g., Invoice).
- Employee – Filters by responsible employee/purchaser.
- Items – Restricts the analysis to selected items.
- Vendor – Restricts the analysis to selected vendors.
Key Visualizations
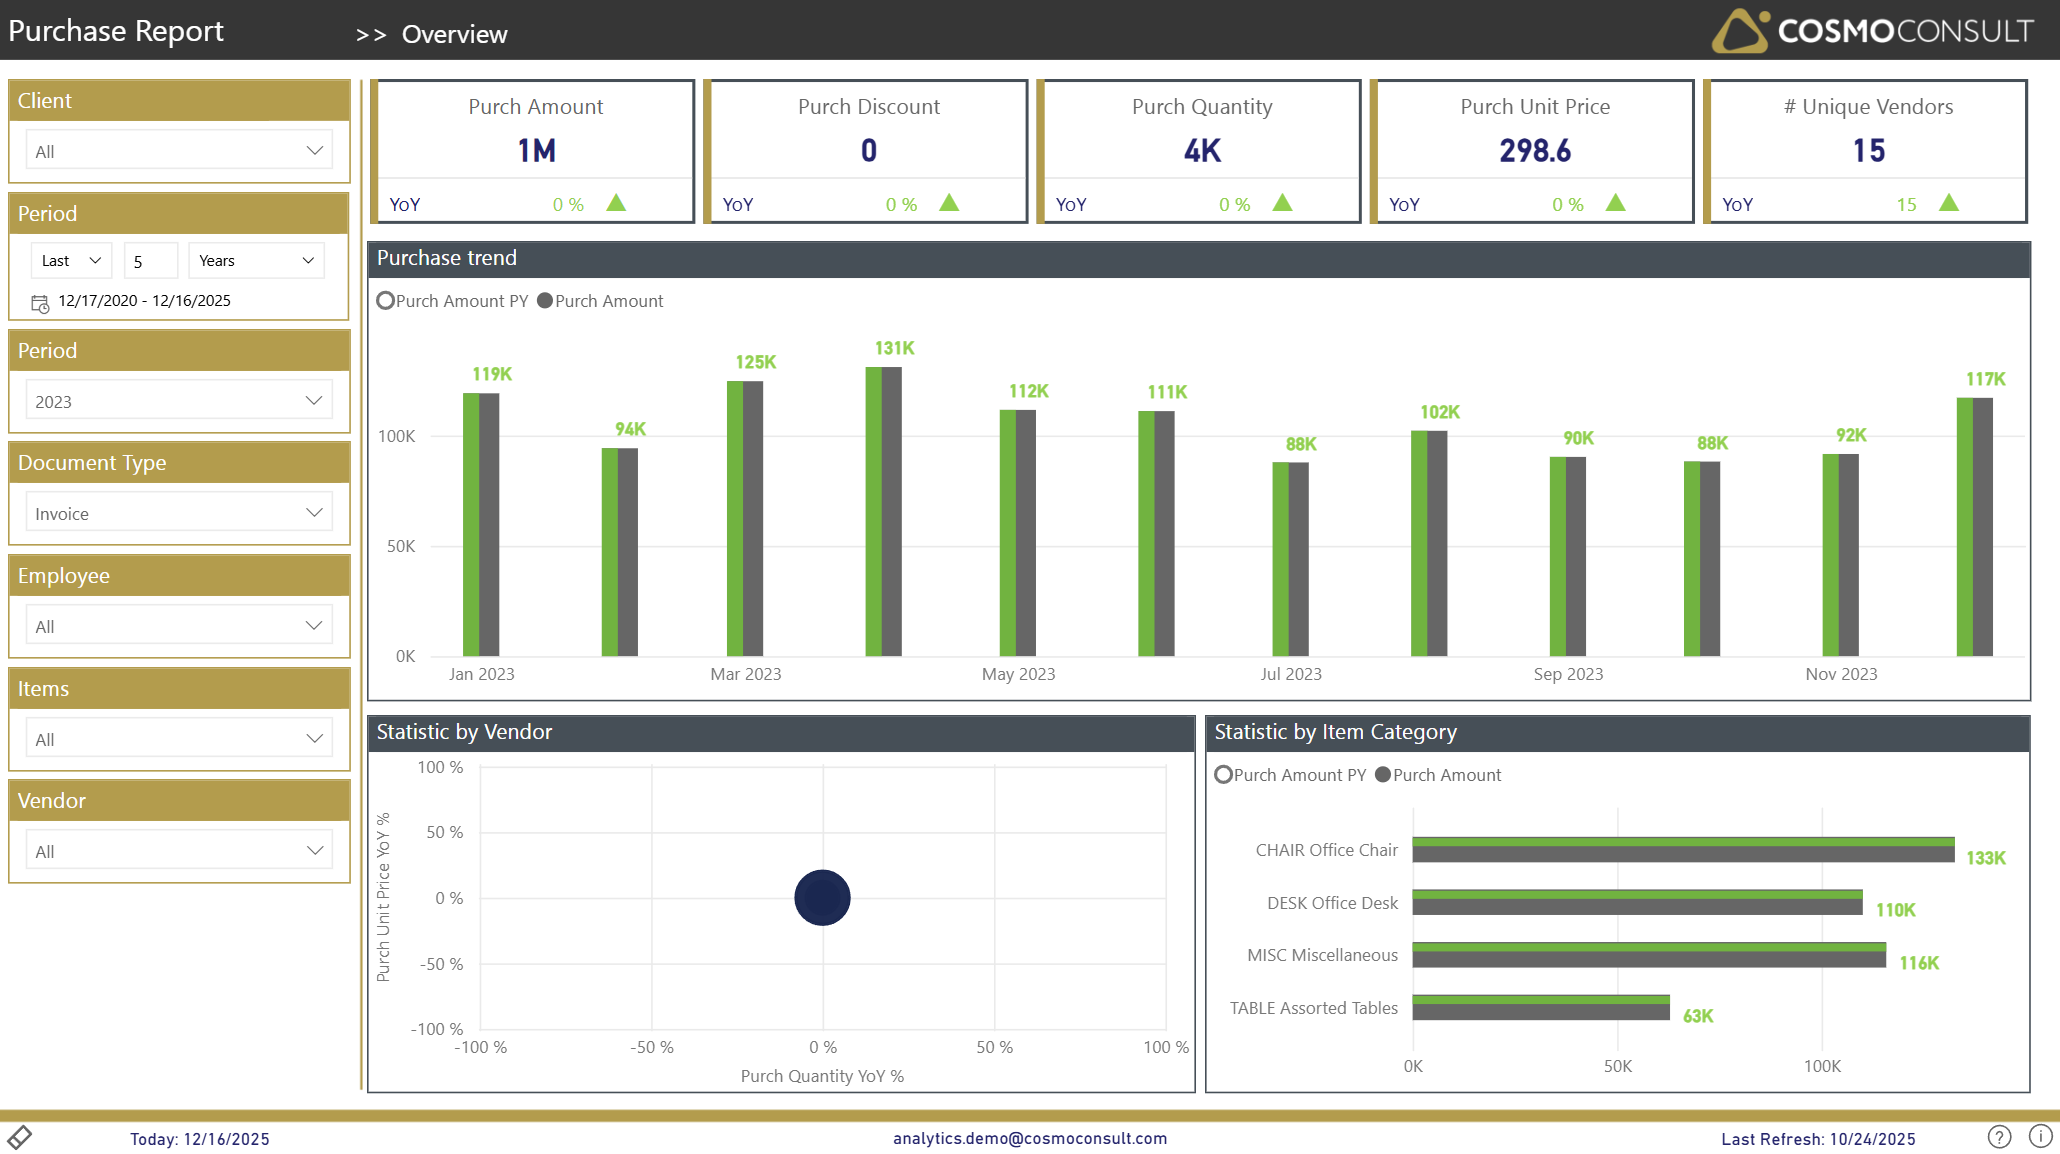
KPI Summary Tiles
Top-row tiles show the main purchasing indicators for the current filter context:
- Purch Amount – total net purchase amount.
- Purch Discount – total purchasing discounts granted.
- Purch Quantity – total quantity purchased.
- Purch Unit Price – average unit price across all purchases.
- # Unique Vendors – number of active vendors in the selected period.
Each tile includes a YoY (Year-over-Year) indicator so you can immediately see how the current value compares to the previous year.
Purchase Trend
Column chart showing monthly development of purchasing:
- Compares Purch Amount with Purch Amount PY (prior year) per month.
- Helps to identify peaks, troughs, and seasonality in purchasing.
- Highlights whether current purchasing is above or below last year for each month.
Statistic by Vendor
Scatter chart displaying vendor-level changes:
- X-axis: Purch Quantity YoY %.
- Y-axis: Purch Unit Price YoY %.
- Bubbles: Vendors (bubble size indicates their relative importance).
This visual helps you:
- Detect vendors where quantities and/or prices have changed significantly year-over-year.
- Identify vendors with rising prices (positive Purch Unit Price YoY %) or declining volumes.
Statistic by Item Category
Horizontal bar chart breaking down spend by item category:
- Shows Purch Amount and Purch Amount PY per item category.
This breakdown supports:
- Understanding which product groups drive total spend.
- Comparing current-year vs. prior-year purchasing per item category.
Interactive Capabilities
- Slicer Interaction: All slicers (Client, Period, Document Type, Employee, Items, Vendor) instantly recalculate all visuals.
- Cross-filtering: Clicking a bar or bubble filters other visuals on the page to that context.
- Sorting: Tables and charts can be sorted by value (e.g., highest Purch Amount first).
- Tooltips: Hover over columns, bars, or bubbles to see detailed values (e.g., exact Purch Amount, YoY %, category/vendor name).
Typical Use Cases
Executive Purchasing Overview
Use the KPI cards and trend chart to assess whether purchasing amounts and quantities are on track compared to last year and whether the supplier base is stable.
Budget & Trend Monitoring
Monitor monthly developments and YoY comparisons to validate purchasing against budget or forecast and identify months that require deeper analysis.
Structural Spend Analysis
Use the vendor scatter chart and item-category bar chart to understand where spend is concentrated and which vendors or categories show unusual YoY behavior.