Sales Report – by Employee
The by Employee page focuses on sales performance per salesperson, enabling sales management to steer teams and individuals based on objective data.
Overview
This page helps you:
- Compare sales and profit between employees or sales teams
- Understand how average order size differs across salespeople
- Track how each employee’s performance develops compared to last year
- Support bonus, target setting and coaching discussions with fact-based KPIs
Filters
By combining the usual slicers (Client, Period, Items, Order Customer) you can:
- Evaluate an employee’s performance for a defined product portfolio or customer group
- Compare team performance across companies or regions
- Analyze long-term trends by looking at multiple years
Key Visualizations
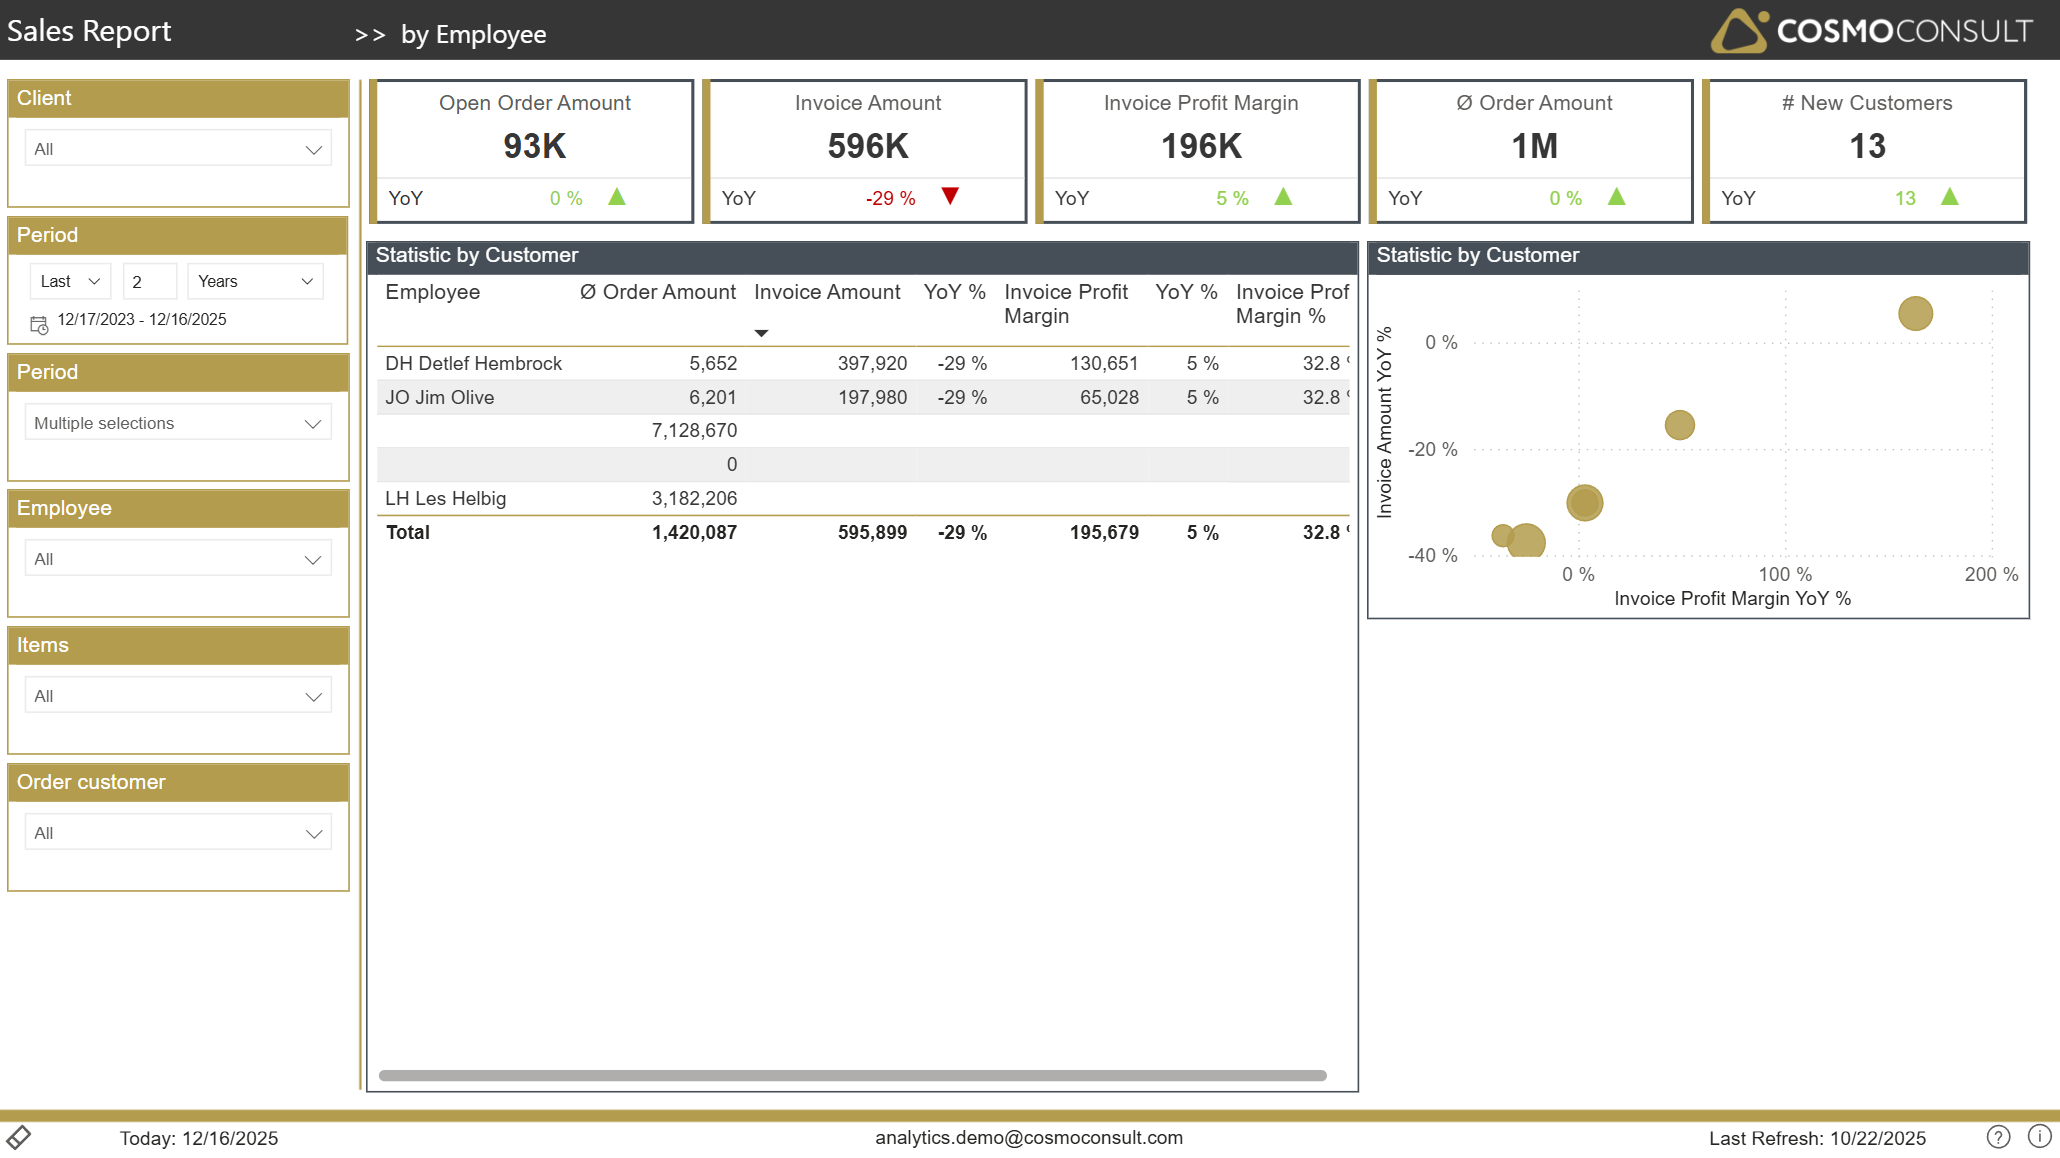
Employee Performance Table
This table aggregates core KPIs per employee:
- Average order size
- Invoiced sales and corresponding YoY change
- Absolute profit and margin development
It enables you to:
- Rank employees by revenue, profit or margin
- Identify top performers and those needing support
- Recognize patterns such as high revenue but low margins (indicating aggressive discounting)
Employee Performance Scatter
A scatter chart positions each employee by sales and margin change versus last year. This visual quickly shows:
- Who is growing both in revenue and profitability
- Who maintains sales but at the cost of margin
- Who is losing volume and profits, signalling potential issues in territory or customer portfolio
Typical Use Cases
- Sales Team Steering – use the page in sales meetings to review targets, highlight successes and address performance gaps.
- Incentive & Bonus Planning – base variable compensation on transparent KPIs such as revenue growth and margin improvement.
- Coaching & Training – identify employees who might benefit from pricing or negotiation training.
- Territory Realignment – combine employee and customer insights to redistribute responsibilities for better market coverage.