Sales Report – by Item
The by Item page provides an item-centric view on sales performance, allowing you to manage your product portfolio based on facts rather than intuition.
Overview
This page helps you:
- Understand which items and item categories drive revenue and profit
- Identify slow- and fast-moving products from a sales perspective
- Monitor how item performance evolves over time compared to last year
- Support assortment, pricing and promotion decisions with detailed item KPIs
Filters
The same global filters as on the Overview page are available (Client, Period, Employee, Items, Order Customer). In an item context they allow you to:
- Analyze performance of a single product or product family
- Focus on items sold by a specific salesperson
- Compare product behaviour between time periods or companies
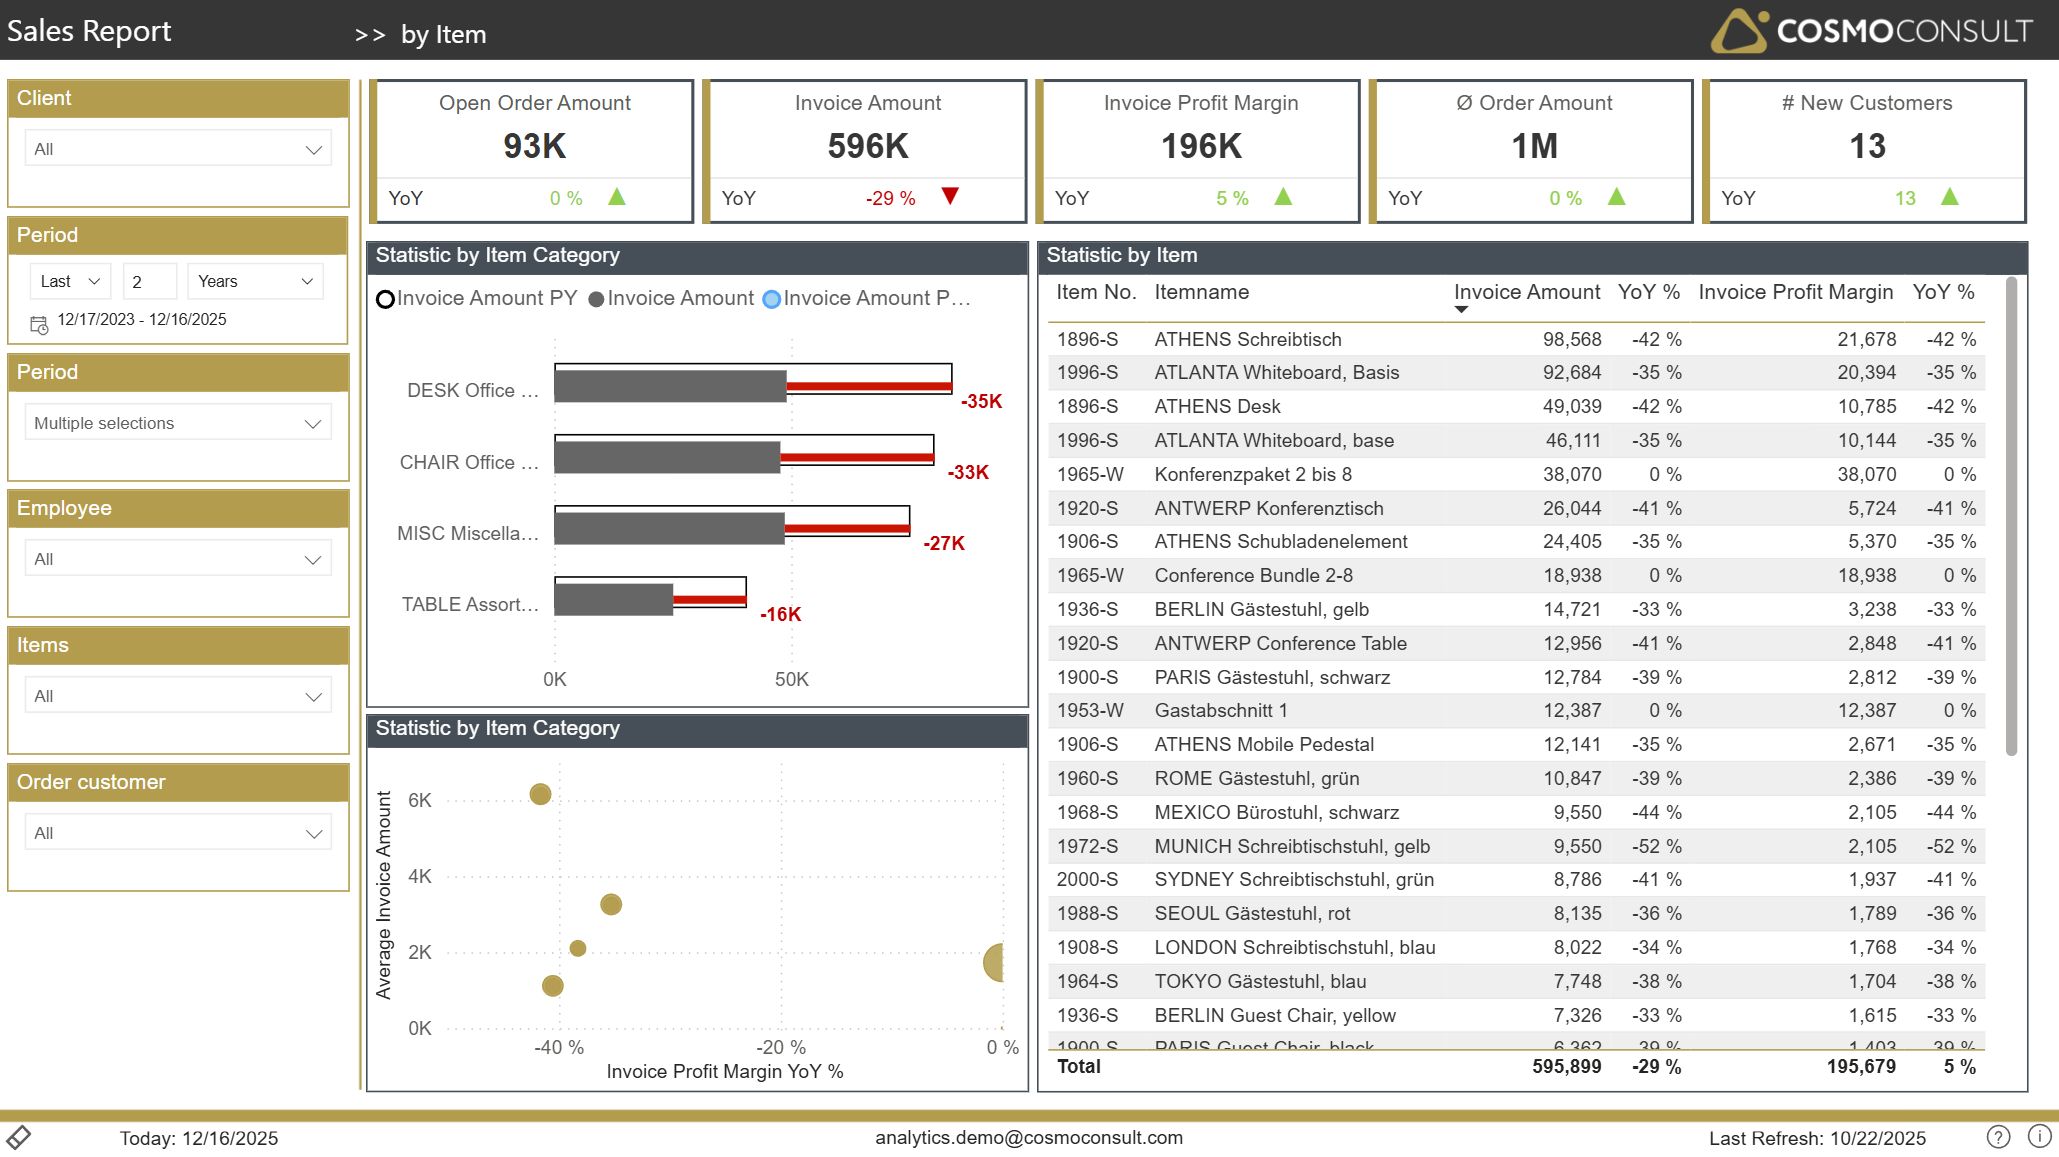
Key Visualizations
Item Category Comparison
A bar chart contrasts sales per item category. Benefits:
- Quickly identify winning and underperforming categories
- Provide input for category/product management and purchasing decisions
Item Ranking Table
A detailed table ranks items by invoice amount, showing for each product:
- Sales volume and YoY change
- Profit contribution and margin development
This enables you to:
- Focus on the relatively small number of items that generate most of your sales
- Recognize products with high revenue but weak margins
- Detect items where sales are shrinking despite stable or attractive margins
Item Category Profitability Scatter
A scatter plot compares item categories by average invoice size and margin development. This helps you:
- Differentiate between high-value, low-frequency items and low-value, high-frequency ones
- Identify categories that are becoming more or less profitable over time
- Prioritize product groups for detailed deep-dive analysis or promotional activities
Typical Use Cases
- Portfolio Optimization – decide which items to promote, maintain or phase out based on revenue and margin insights.
- Pricing Review – focus on items with strong sales but low margins to evaluate pricing, discount structures or sourcing.
- Sales & Purchasing Alignment – share item performance data with purchasing to negotiate better conditions for key products.
- Campaign Targeting – select suitable items for campaigns (e.g. slow movers with healthy margins or fast movers with high contribution).
- Identify Top Customers per Item – use the drill-through functionality to see which customers are driving sales for specific items.