Demand outlook
This user manual is designed to help you navigate and utilize the Demand Outlook dashboard effectively. The dashboard provides insights into demand and supply metrics, enabling better inventory management and forecasting.
Filter
- Client Selection: Choose the client from the dropdown menu to filter the data relevant to that specific client.
- Period Selection: Set the date range for your analysis using the period selector. This allows you to view data for specific time frames.
- Location Filtering: Use the location dropdown to focus on specific warehouses or distribution centers.
- Item Selection: Filter the data by item to analyze specific products.
- Item Category: Select the item category to narrow down the analysis to a particular group of products.
- Item Posting Group: This feature allows you to filter items based on their posting group for more granular analysis.
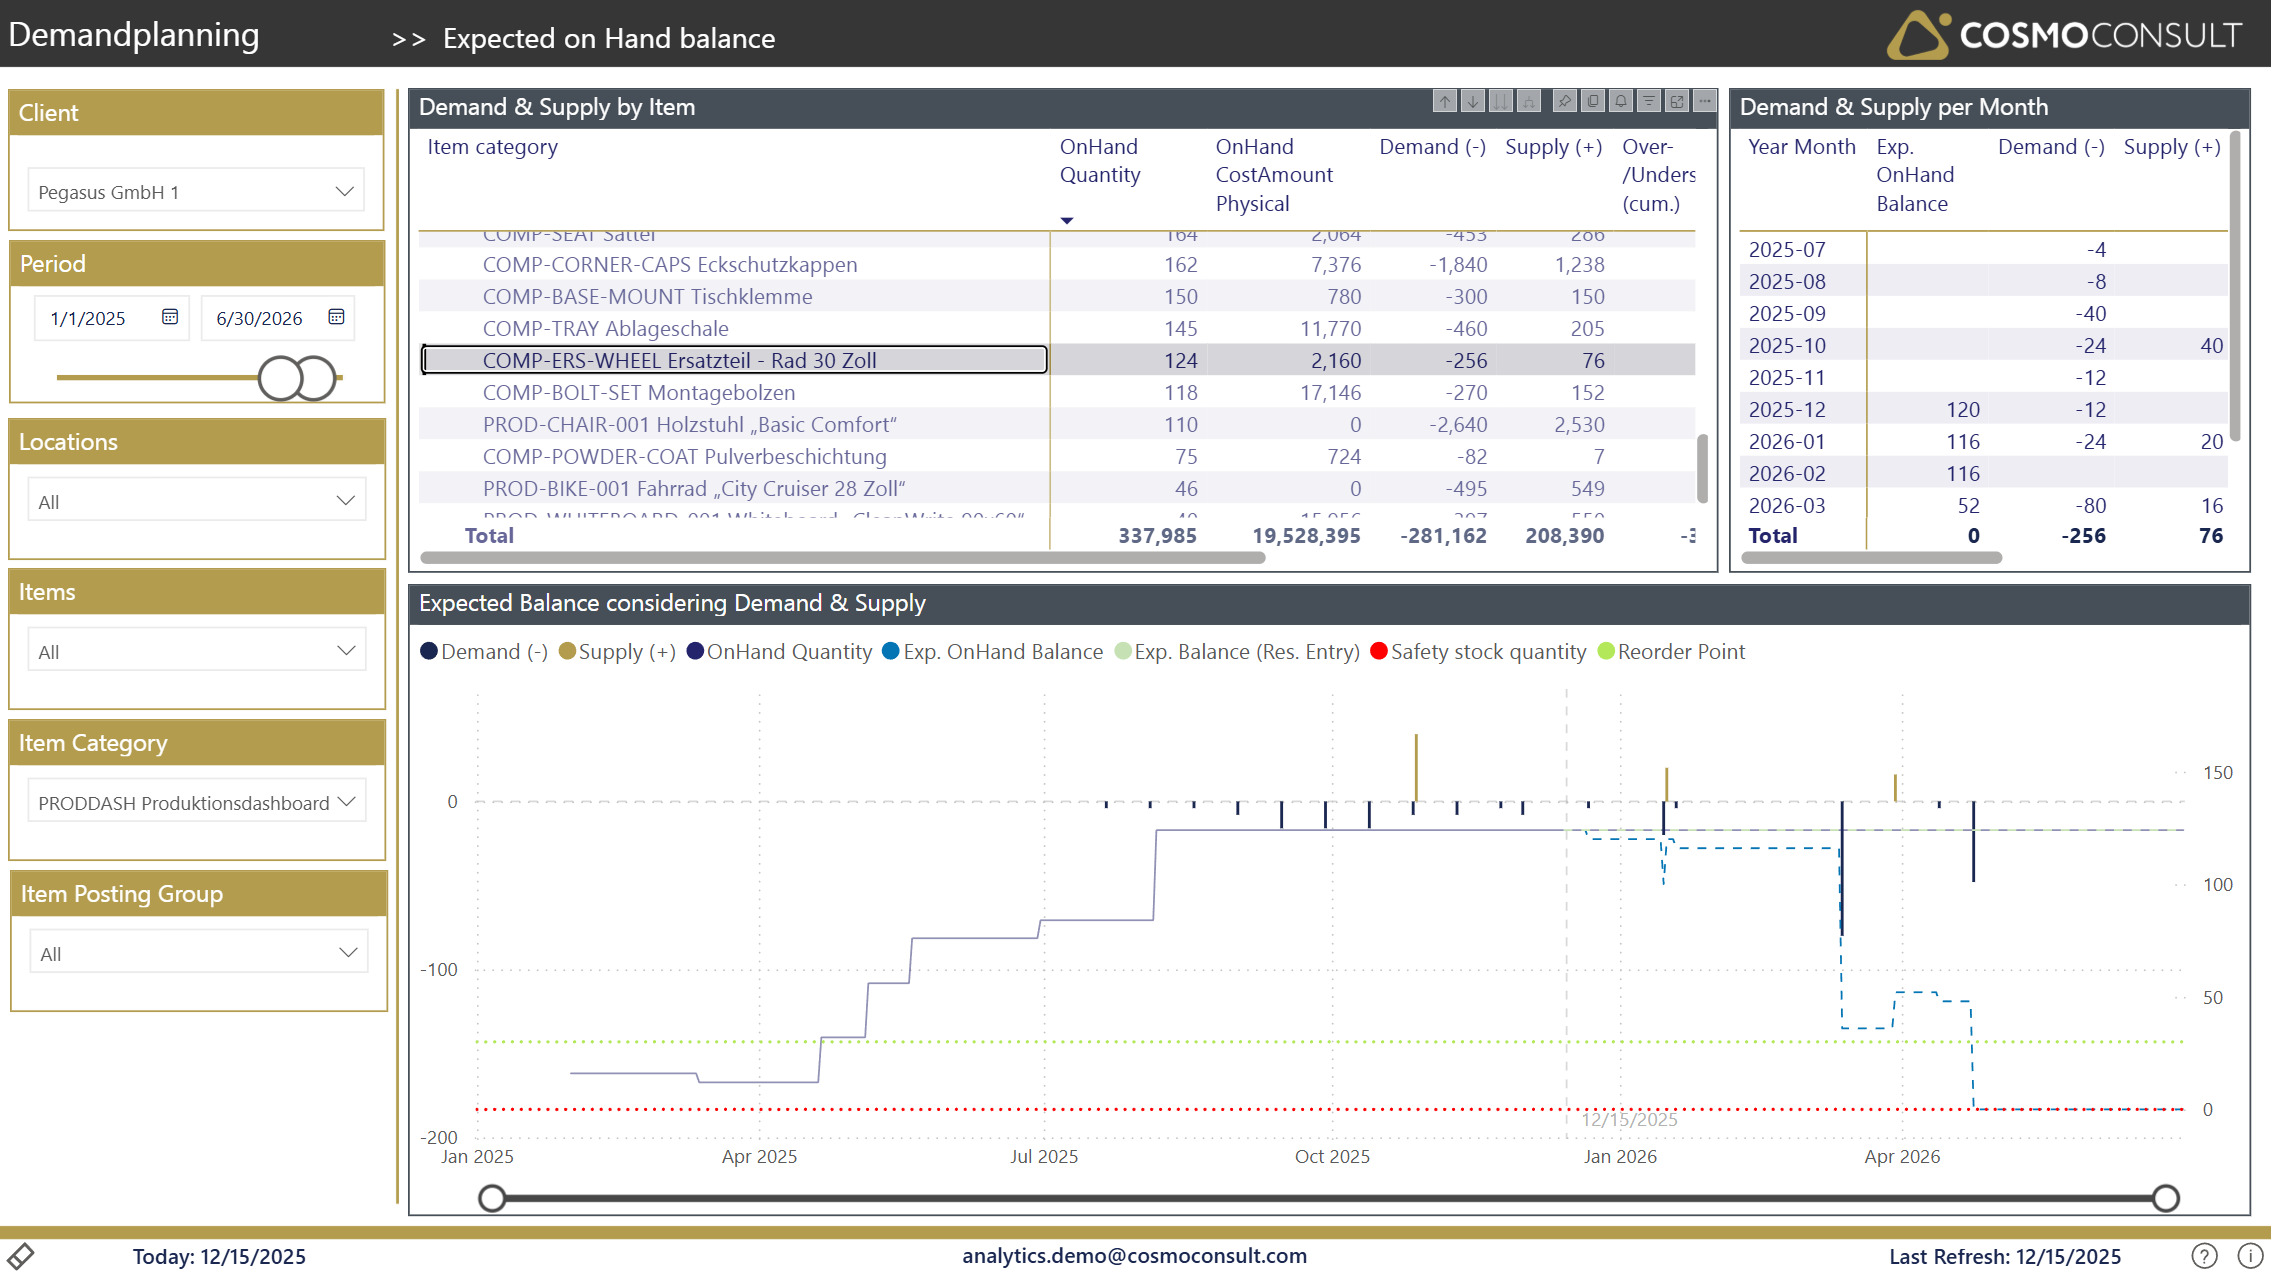
Demand & Supply by Item
This section displays a detailed list of items along with their respective metrics and can be used for sorting and interactive filtering:
- OnHand Quantity: The current quantity of items available.
- OnHand Cost Amount: The total cost of the items currently in stock.
- Demand (-): The total demand for the items, represented as a negative value.
- Supply (+): The total supply of the items, represented as a positive value.
- Over/Undersupply (cum. outlook): This metric indicates whether there is an over or undersupply situation based on cumulative data.
- Over/Undersupply Amount (cum. outlook): This provides the total amount of over or undersupply, assisting in inventory planning.
- RP: Alerts users when the expected inventory level is projected to fall below the reorder point, prompting timely reordering.
- SS: Similar to the reorder point warning, this alerts users when inventory is expected to dip below the safety stock level, which is critical for maintaining service levels.
The Tooltip provides a comprehensive overview of maintained replenishment parameters on Item & Location level.
Demand & Supply per Month
This section provides a month-by-month breakdown of expected on-hand balance, demand, and supply. It helps in understanding trends over time and making informed decisions.
- Year/Month: Displays the specific month and year for the data.
- Exp. OnHand Balance: The expected balance of inventory after accounting for demand and supply.
- Demand: The total demand for that month.
- Supply: The total supply available for that month.
Expected Balance Considering Demand & Supply
The graph visualizes the expected balance of inventory, considering recorded demands & supplies of business central documents and shows following details:
- Primary Y-Axis (Bar Chart):
- Shows Demands (-) & Supplies (+) per Period
- Tooltip provides additional details about
- demand and/or supply source and
- expected due dates
- balances
- Secondary Y-Axis (Line Chart):
- OnHand Quantity (blue line): Stock level - shows historic changes in stock-level. value changes usually until last load date.
- Exp. OnHand Balance (orange): The projected balance considering OnHand Quantity (stock level on loading date) together with cumulated (future) demands & supplies.
- Exp.Balance (Res. Entry) (light red): The projected balance according reservation entries (usually generated by MRP run).
- Safety Stock Quantity (dotted red): The minimum level of stock to maintain service levels. This line is only visible when an item (and location) combination with maintained SKU is selected.
- Reorder Point (dotted green): The level at which new stock should be ordered to avoid shortages. This line is only visible when an item (and location) combination with maintained SKU is selected.
Drill-Throughs
...are available accross this report, navigating to filtered, detailed pages for
- Demand details
- Supply details