Item Classification (ABC/XYZ)
Categorize items by demand significance (ABC) and demand stability (XYZ) to target inventory strategies.
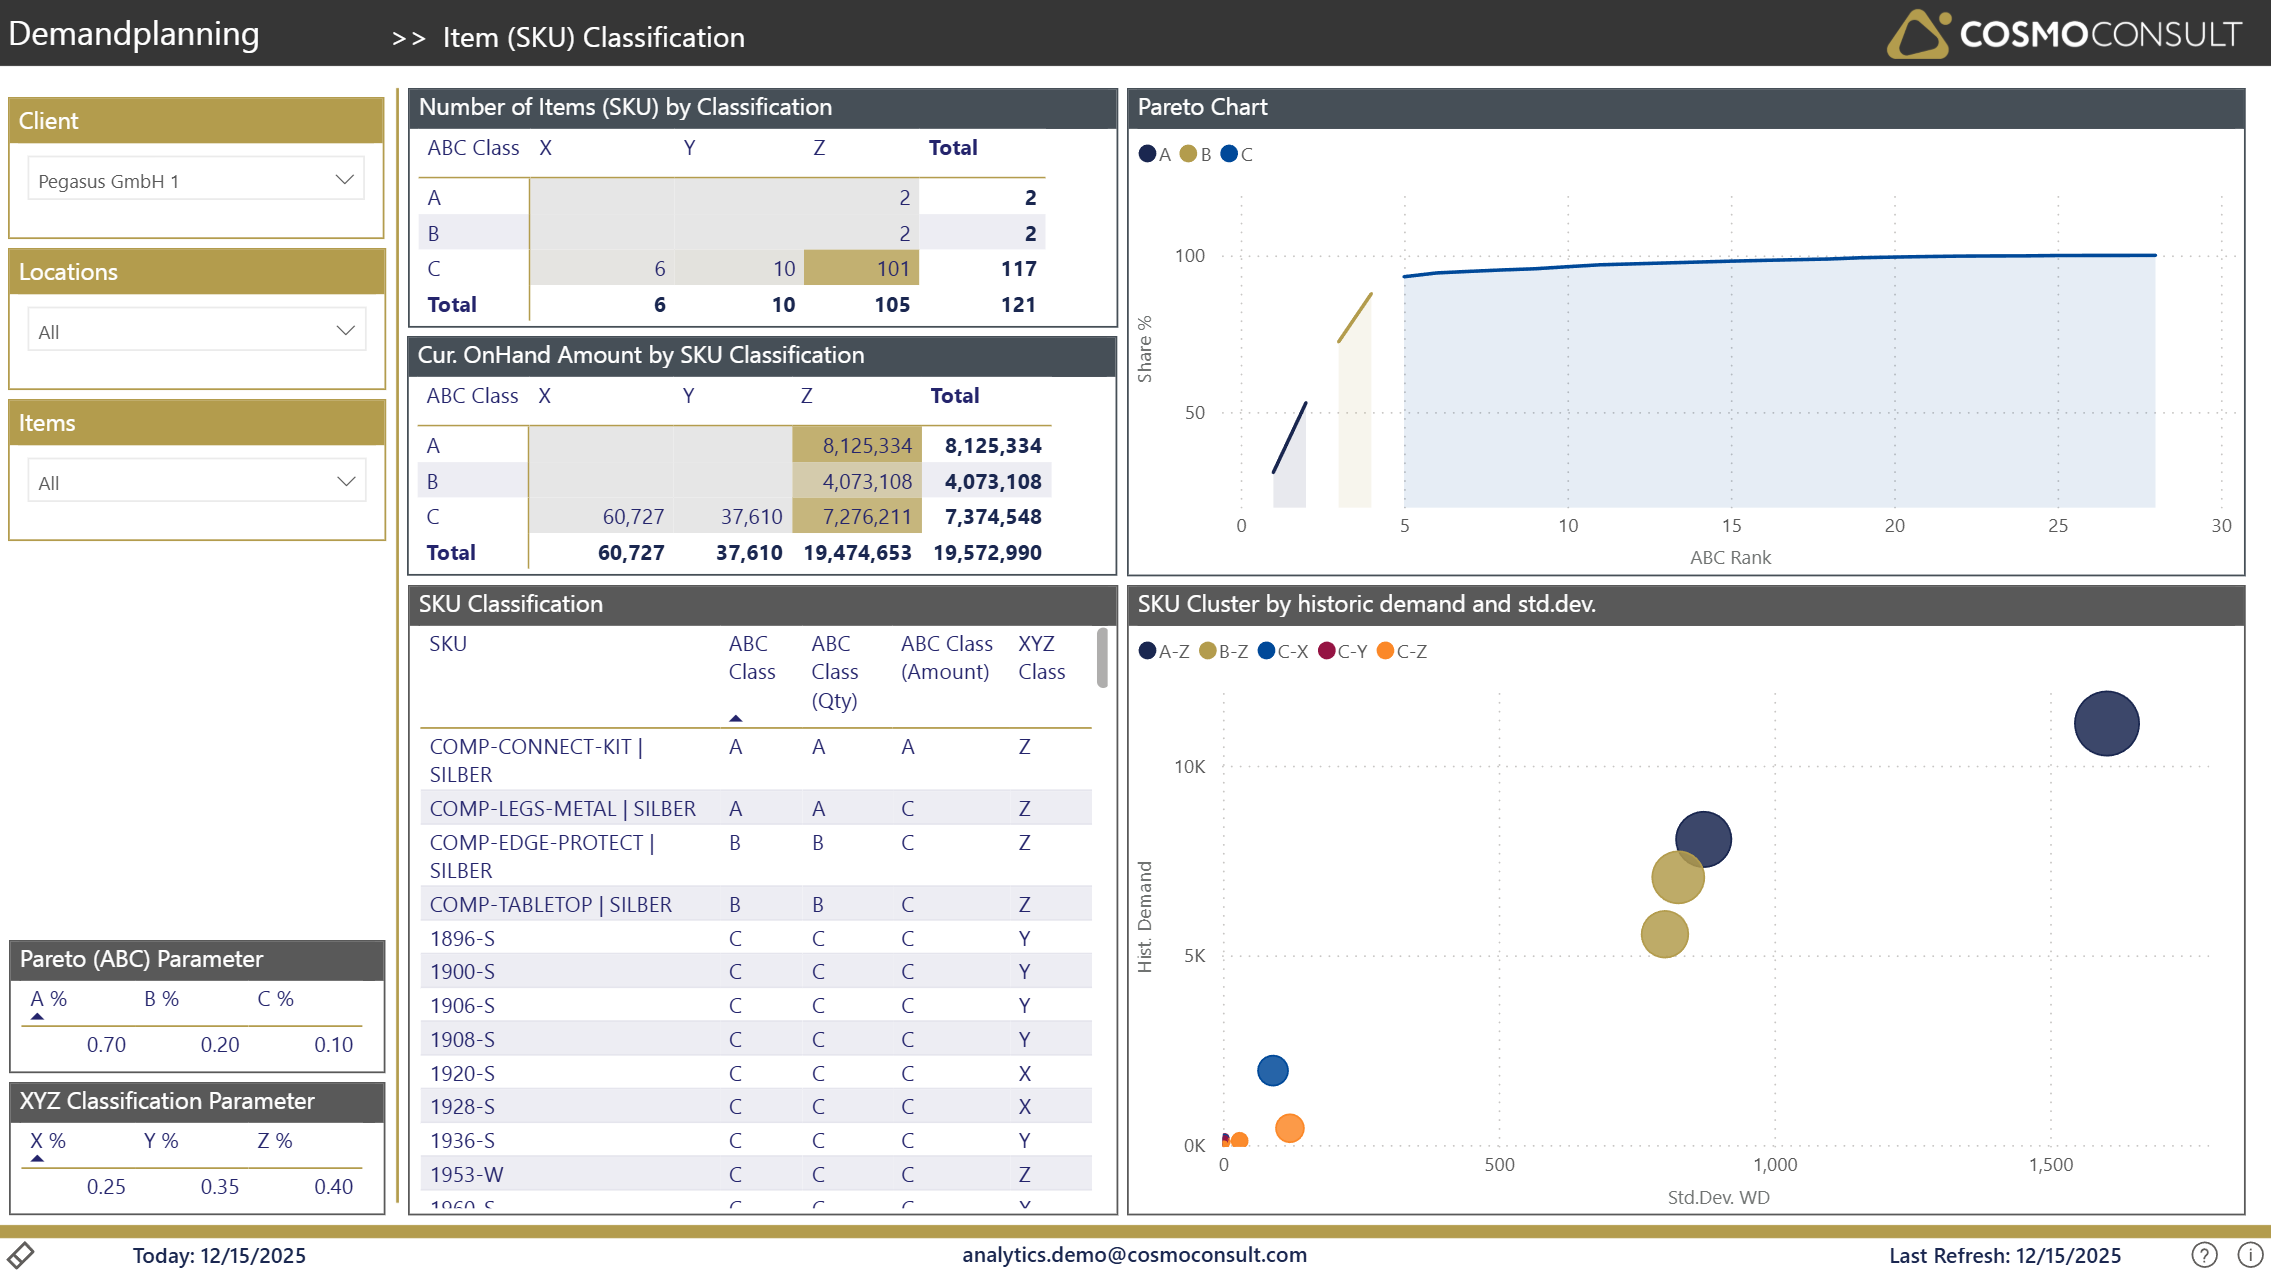
Understand both the significance and the stability of every item so you can set segment-specific inventory policies: ABC ranks items by their share of demand value (Pareto), XYZ by how stable their demand is.
At a glance
Generated from the report definition (Artikel-Klassifizierung / Artikel-Klassifizierung).
- Key visuals: line chart, 2× matrix, scatter chart, 3× table
What this report helps you do
- Classify items into ABC (significance) and XYZ (stability) segments
- See where capital is tied up across the nine ABC/XYZ segments
- Compare classification by quantity versus by amount to pick the right method
- Derive segment-specific safety-stock and reorder policies
Filters & slicers
| Filter | What it does |
|---|---|
| Client, Location, Item (Category) | Focus the classification on a company, location or item scope. |
Visuals on this page
ABC/XYZ Classification Matrix
A matrix (pivot) of # SKUs across the nine ABC x XYZ segments; click a cell to filter the item table to that segment.
- See how items distribute across significance and stability segments
- Focus analysis on a specific segment (e.g. AZ - important but volatile)
OnHand Amount by Classification
A matrix of OnHand CostAmount Physical by ABC and XYZ class, revealing where inventory value is concentrated.
- Identify segments that tie up the most capital
- Prioritize optimization where value is highest
Pareto (ABC) Curve
A line chart of the cumulative share of client total (cum % of ClientTTL) by ABC rank, illustrating the Pareto distribution.
- Visualize how few items drive most of the demand value
- Set or review the A/B/C thresholds
SKU Classification Details Table
A table with SKU, ABC Group (used), ABC Group (Qty), ABC Group (Amount) and XYZ Group - compare the quantity- and amount-based classifications side by side.
- Decide whether quantity- or amount-based ABC fits your business
- Review each SKU's combined ABC/XYZ classification
SKU Cluster by Historic Demand & Std. Deviation
A scatter plot of each SKU's average weekly demand (WeeklyDemand Avg) against its standard deviation (WeeklyDemand StdDev), color-coded by ABC class.
- Understand demand variability and natural clusters
- Spot outliers with unusually high or volatile demand
Typical use cases
- Understanding Inventory Composition — See the distribution of items by value and demand stability to derive inventory strategies.
- Deriving Priorities — Define focus areas for inventory management based on item classification.
- Segment-Specific Policies — Establish different safety-stock and reorder-point policies for each ABC/XYZ segment.
Related KPIs
- # SKUs
- OnHand CostAmount Physical
- HistoricDemand
- WeeklyDemand Avg
- WeeklyDemand StdDev
See the full KPI & measure catalog for definitions and formats.
Back to all Demand Planning standard reports · Semantic model · Key business questions