Demand Planning Standard Reports
The Demand Planning app ships with the pre-built Power BI reports below. Start with the Overview page, then drill into the specialized reports.
Reports in this module
| Report | What it covers |
|---|---|
| Overview (this page) | The central cockpit for monitoring overall inventory health as the foundation for demand and supply planning. |
| By Location | A location-centric view on inventory, to balance stock across warehouses and distribution centers. |
| By Item | An item-centric view on inventory, to manage the product portfolio and spot slow and fast movers. |
| Item Analysis | Transaction-level validation of movements and statistical lead-time analysis for procurement. |
| Demand Outlook | The forward-looking heart of the module - the expected future availability balance from recorded demand and supply. |
| Master Data | A single view of all maintained replenishment parameters (SKUs), with direct links into Business Central. |
| Item Classification (ABC/XYZ) | Categorize items by demand significance (ABC) and demand stability (XYZ) to target inventory strategies. |
| Replenishment Optimization | Advanced analytics that propose optimized safety stock and reorder points from historical demand, lead times and a target service level. |
Overview
The central cockpit for monitoring overall inventory health as the foundation for demand and supply planning.
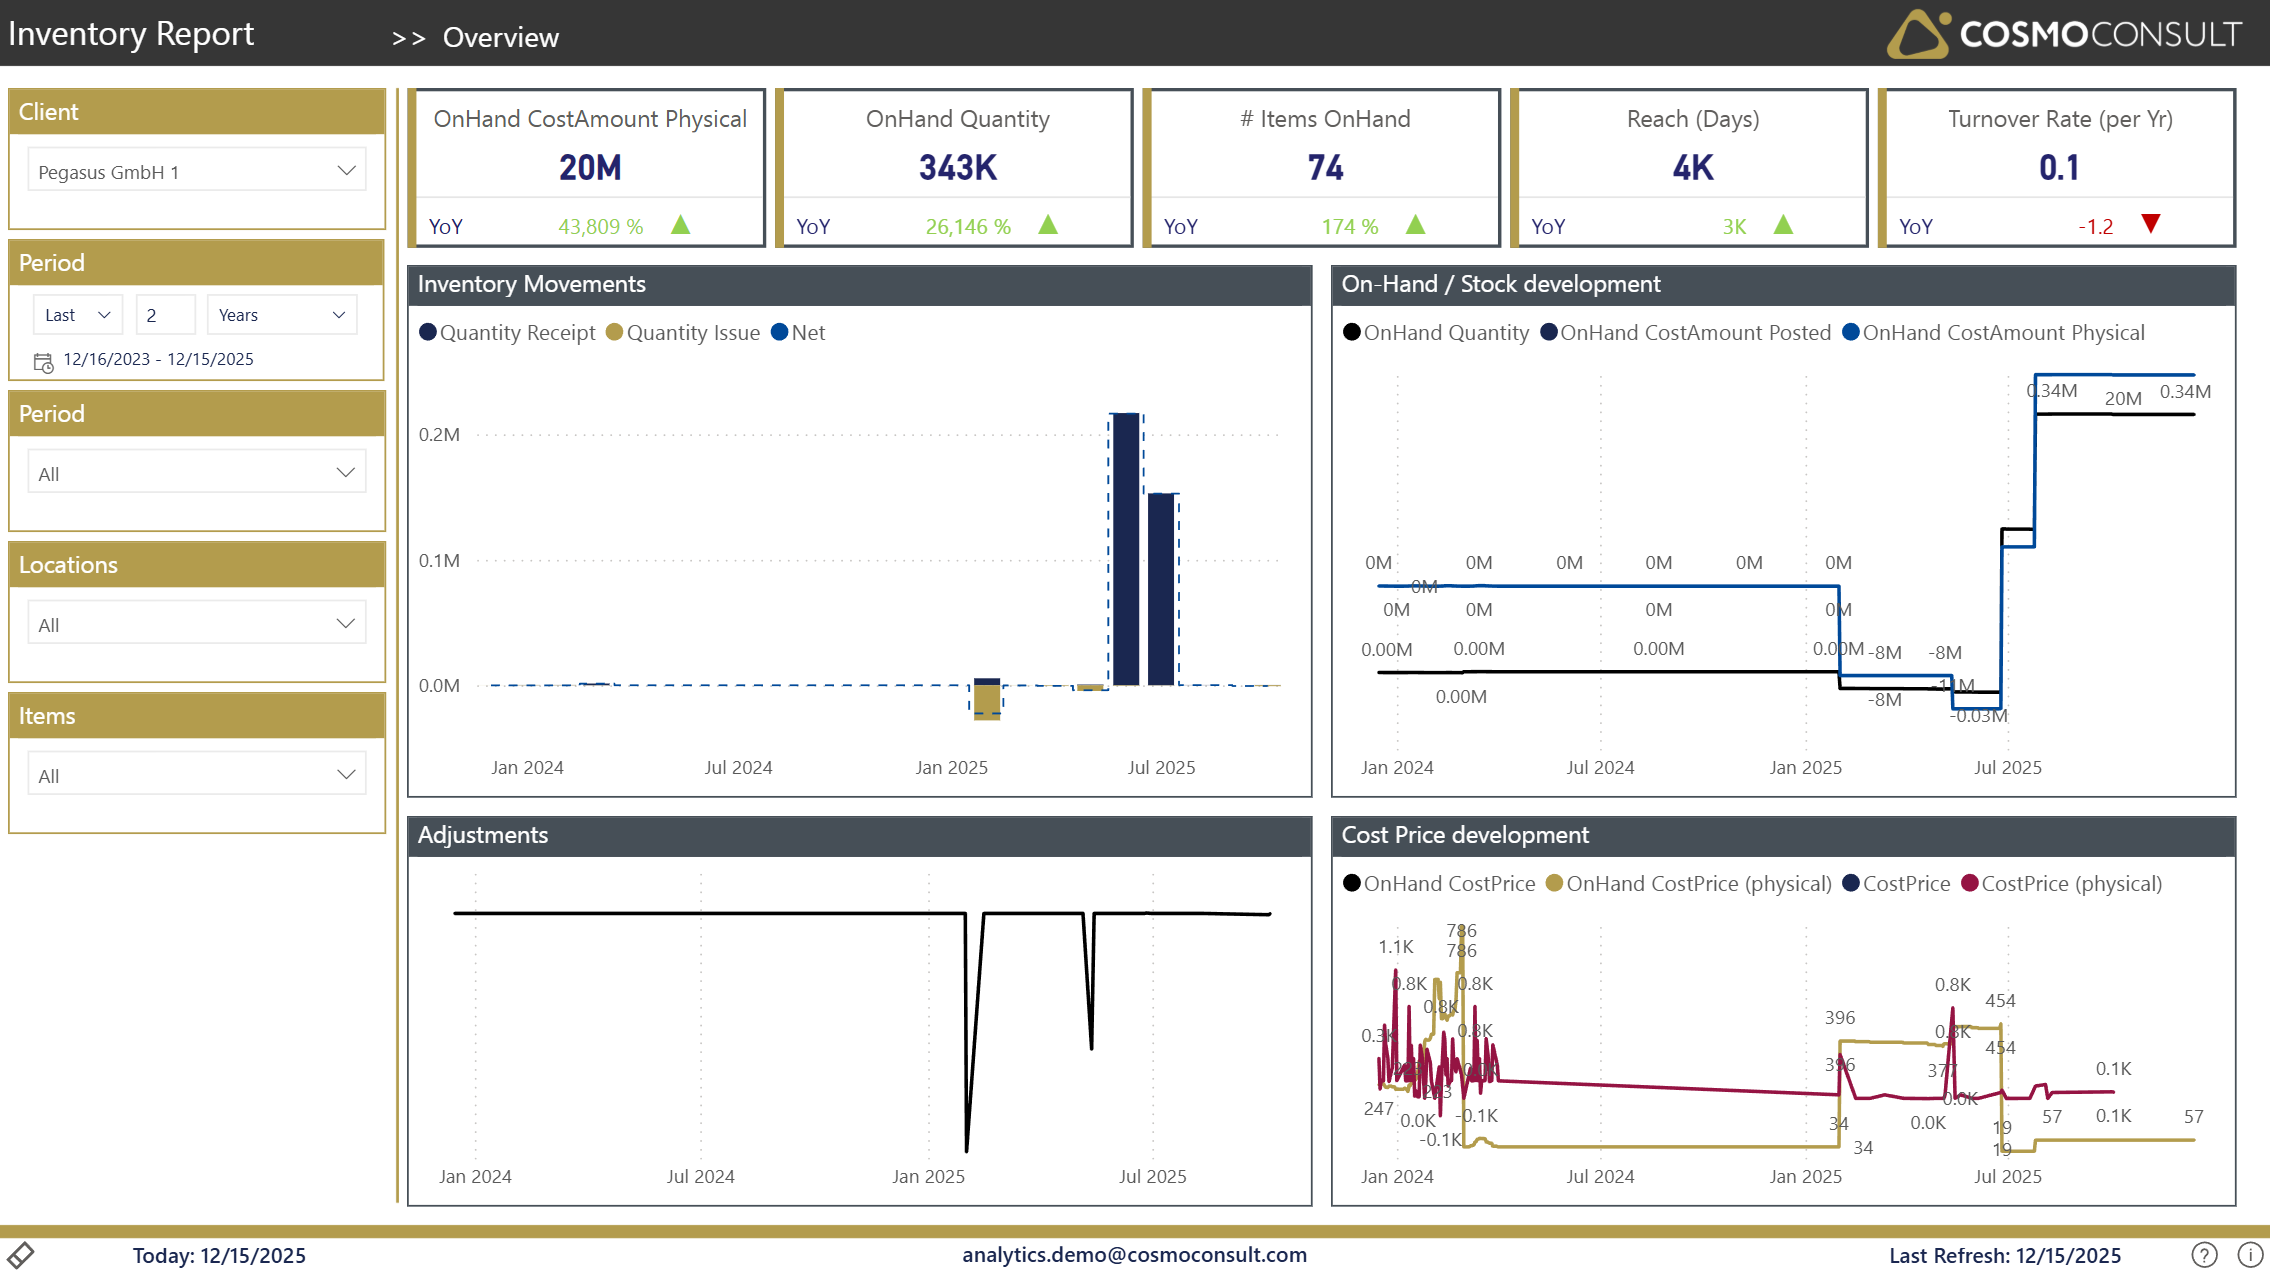
A management-level summary of the most important stock KPIs plus the high-level trends that frame every planning decision: inventory movements, on-hand quantity and valuation, cost-price development and inventory-value adjustments.
At a glance
Generated from the report definition (Überblick / Überblick).
- Key visuals: 3× line chart, lineStackedColumnComboChart
What this report helps you do
- Understand overall inventory health quickly for the selected period, location and item scope
- Identify long-term trends in issued and receipt quantities
- Track on-hand / stock development in both quantity and valuation
- Monitor cost-price development and inventory-value adjustments
- Decide where to dive deeper - by location, by item, or into the demand outlook
Filters & slicers
| Filter | What it does |
|---|---|
| Client | Selects the D365 BC company / tenant; compare entities in multi-tenant scenarios. |
| Period (date / year / month) | Sets the analysis time frame via the date and year/month slicers. |
| Location | Restrict all KPIs and visuals to selected inventory locations. |
| Item (Category) | Focus on specific items or item categories. |
Using these filters consistently ensures that all KPIs and trends reflect the exact scope you want to analyse (e.g. one item category at a defined location in the last fiscal year).
Visuals on this page
KPI Summary Tiles
A quick, management-level view of inventory health.
- OnHand CostAmount Physical - physical value of on-hand inventory.
- OnHand Quantity - total quantity currently on hand.
- # Items OnHand - distinct items in stock.
- Reach (Days) - how many days current stock is expected to last.
- Turnover Rate (per Yr) - how often inventory turns over per year.
Inventory Movements
A combined column/line chart comparing monthly receipt quantity (Quantity Receipt) and issue quantity (Quantity Issue) against the on-hand quantity (Quantity).
- Identify long-term trends and seasonality in inbound and outbound flows
- See whether receipts keep pace with issues over time
On-Hand / Stock Development
A line chart tracking OnHand Quantity and posted/physical inventory value over time on a dual axis, with YoY % in the tooltip.
- Follow how physical stock and its valuation evolve together
- Spot build-ups or depletions of stock and value
Cost Price Development
A line chart comparing on-hand cost price (OnHand CostPrice) and transactional cost price (CostPrice), including their physical variants, over time.
- Detect rising or falling cost prices that affect inventory value
- Understand how average on-hand cost price lags current cost price
Adjustments
A line chart showing inventory-value adjustments (CostAmount Adjustment) over time.
- Track the magnitude and timing of inventory-value corrections
- Flag periods with unusually large adjustments for review
Typical use cases
- Executive Inventory Overview — Use the KPI cards and trend charts to assess whether stock levels, value and reach are on track for the selected scope.
- Movement & Trend Monitoring — Monitor the receipts-vs-issues chart and stock development to detect long-term shifts and seasonality.
- Inventory Valuation Review — Use the cost-price and adjustment charts to understand how valuation and cost effects move the inventory value.
Related KPIs
- OnHand CostAmount Physical
- OnHand Quantity
- # Items OnHand
- Reach (Days)
- Turnover Rate (per Yr)
See the full KPI & measure catalog for definitions and formats.