Demand Outlook
The forward-looking heart of the module - the expected future availability balance from recorded demand and supply.
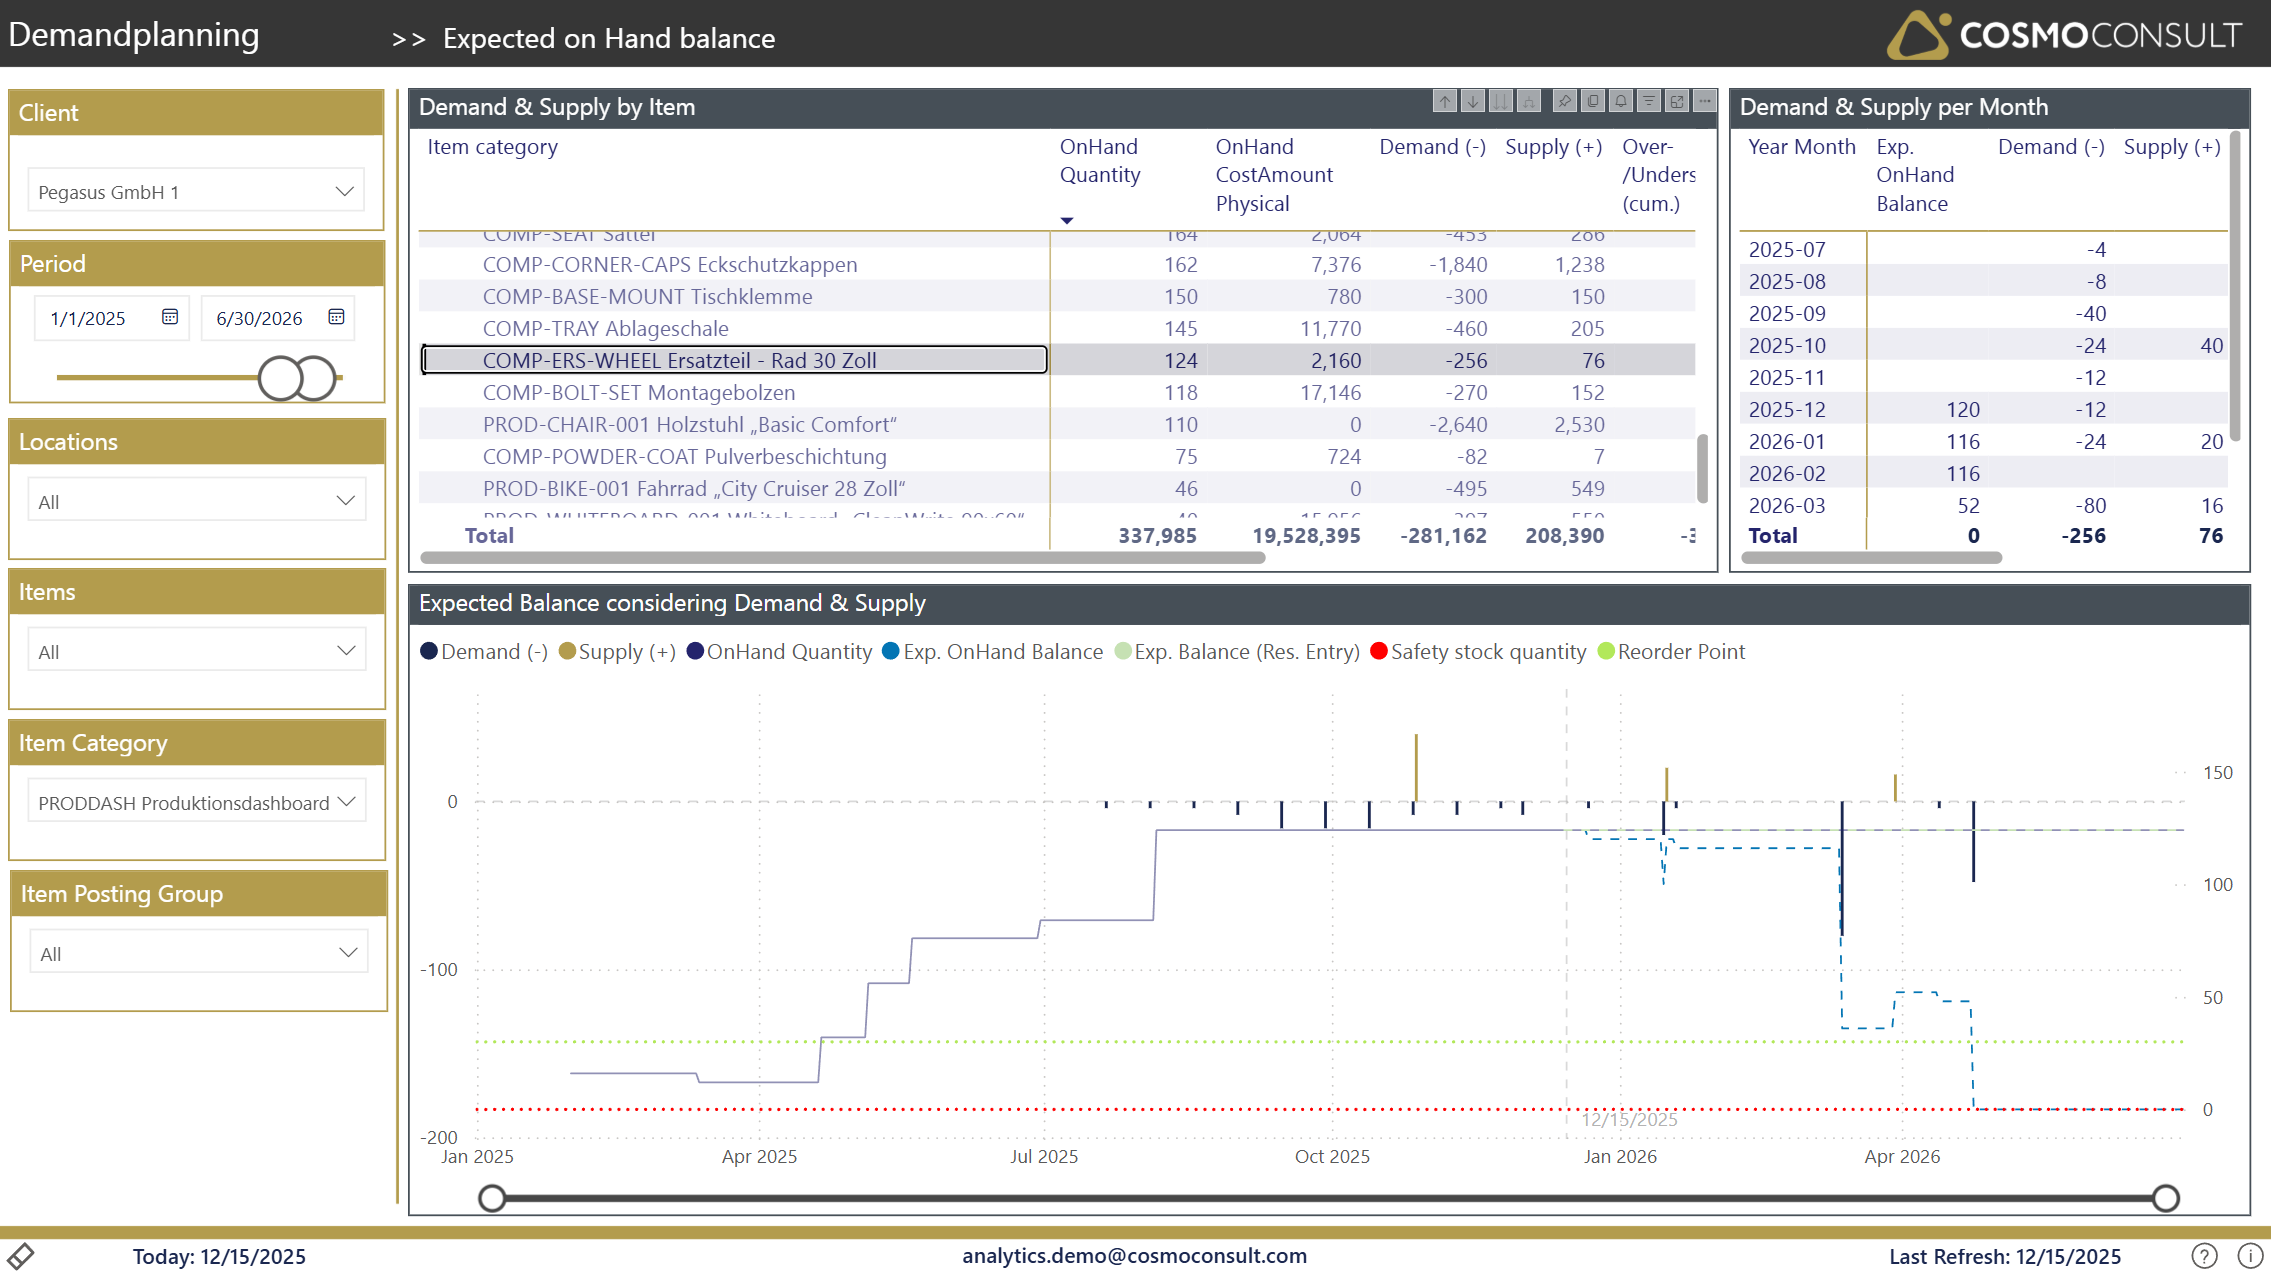
Project the expected on-hand balance by combining current stock with cumulated future demand and supply from Business Central documents, spot over- and undersupply before it happens, and get alerted when an item is projected to drop below its reorder point or safety stock.
At a glance
Generated from the report definition (Bedarfs-Ausblick / Bedarfs-Ausblick).
- Key visuals: lineStackedColumnComboChart, 2× matrix
What this report helps you do
- Analyze the expected availability balance based on demand & supply
- Identify over- and undersupplied items for chosen periods
- Get notified when the projection drops below reorder point or safety stock
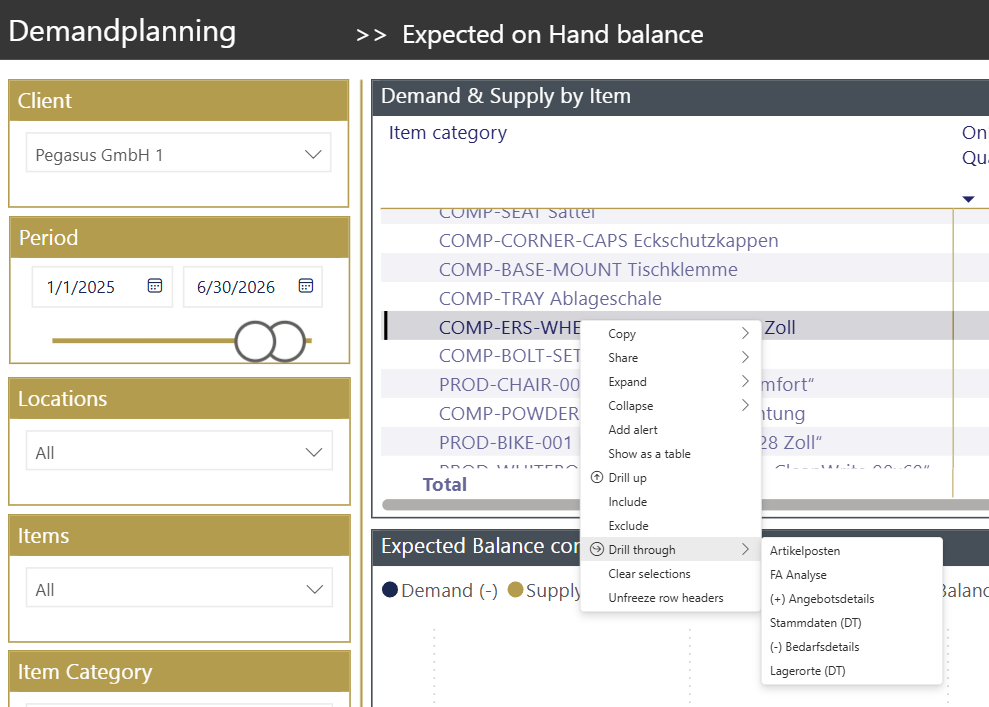
- Trace demand and supply back to the underlying BC documents via drill-through
Filters & slicers
| Filter | What it does |
|---|---|
| Client, Period (date), Location, Item (Category), Item Category, Item Posting Group | Global slicers plus item-category and posting-group filters for granular demand/supply analysis. |
Visuals on this page
Demand & Supply by Item
A table listing items with OnHand Quantity, OnHand CostAmount Physical, Demand (-), Supply (+), Over/Under Supply (Future cum.) and its amount, plus RP and SS warning flags. The tooltip surfaces the maintained replenishment parameters at item & location level.
- Sort and filter items by projected over- or undersupply
- Use the RP / SS flags to prioritize items at risk of shortage
Demand & Supply per Month
A month-by-month table of Expected Future OnHand Balance, Demand and Supply.
- Understand how the balance evolves period by period
- Pinpoint the month a shortage or excess is expected to occur
Expected Balance considering Demand & Supply
A combo chart: bars show Demand (-) and Supply (+) per period; lines show OnHand Quantity, Expected Future OnHand Balance, Expected Balance (Res.Entry), and - when a maintained SKU is selected - the Safety Stock and Reorder Point levels. Tooltips reveal demand/supply source and expected due dates.
- See the projected balance against safety stock and reorder point at a glance
- Compare the document-based projection with the MRP reservation-entry projection
Drill-through & detail pages
Demand & Supply Details
Drill-throughs are available across the report, navigating to filtered detail pages for demand details (sales orders, production-order components) and supply details (purchase orders, production orders / FA details).
Typical use cases
- Shortage Prevention — Use the projected balance and RP/SS warnings to reorder in time and avoid stockouts.
- Overstock Avoidance — Detect cumulative oversupply early and defer or reduce incoming orders.
- MRP Validation — Compare the document-based expected balance with the reservation-entry balance to sanity-check the planning run.
Related KPIs
- Expected Future OnHand Balance
- Demand
- Supply
- Over/Under Supply (Future cum.)
- ReorderPoint
See the full KPI & measure catalog for definitions and formats.
Back to all Demand Planning standard reports · Semantic model · Key business questions