Replenishment Optimization
Advanced analytics that propose optimized safety stock and reorder points from historical demand, lead times and a target service level.
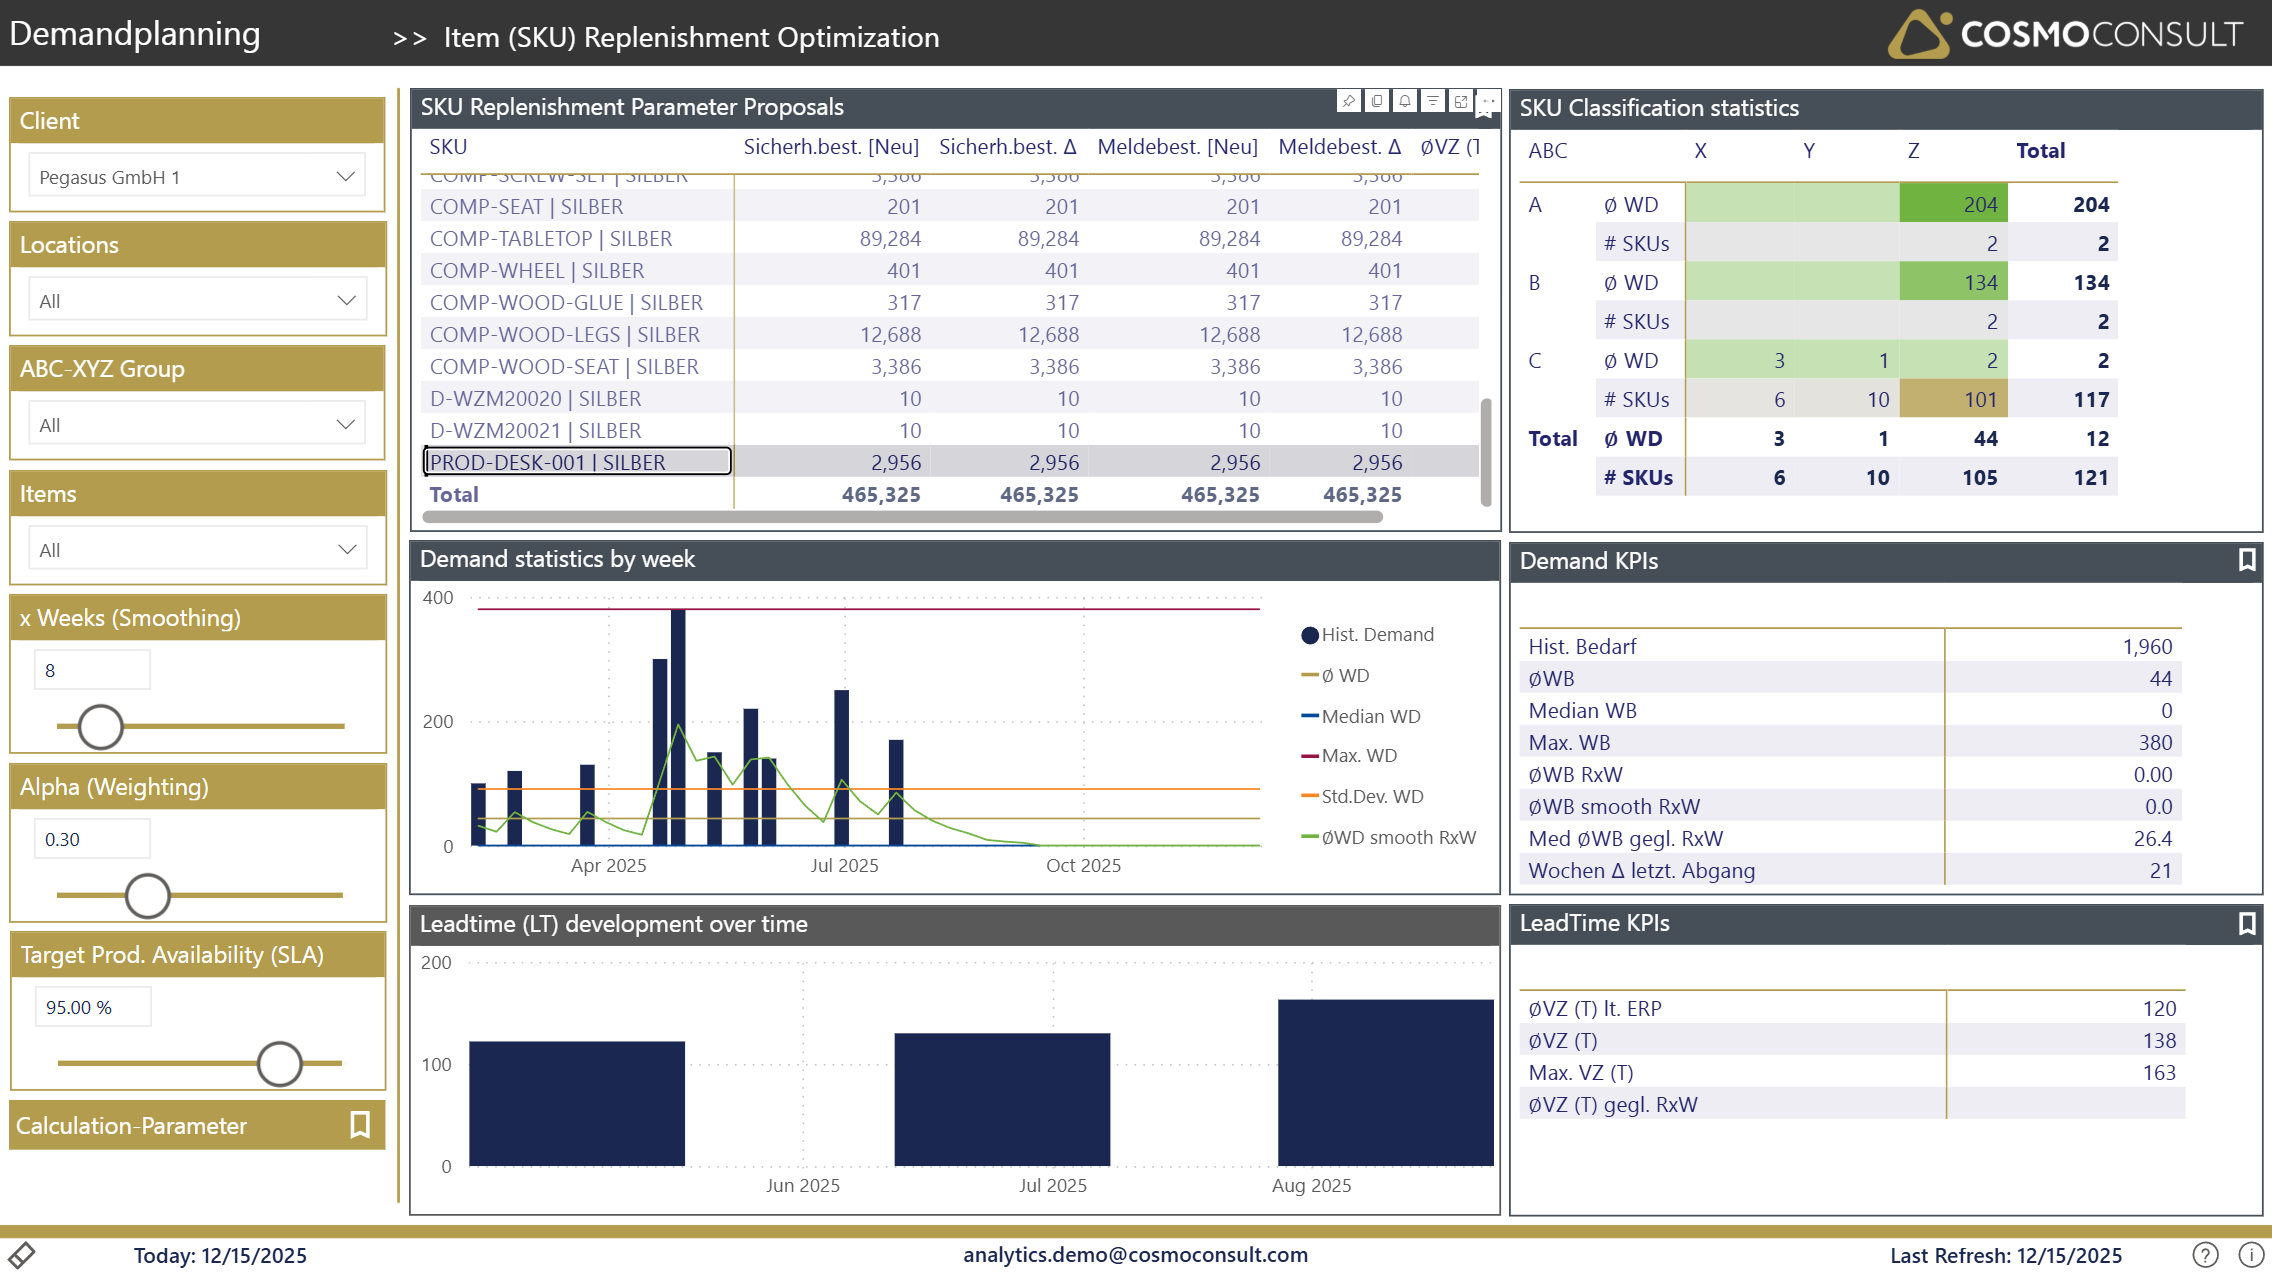
Right-size replenishment parameters with statistical methods: analyze demand variability and lead times, choose calculation methods per XYZ class and a target service level, and compare the proposed safety stock and reorder point against what is currently maintained in BC.
At a glance
Generated from the report definition (Artikel-Optimierung / Artikel-Optimierung).
- Key visuals: column chart, line & column combo, 4× matrix
What this report helps you do
- Calculate optimal safety stock and reorder points from demand and lead-time variability
- Compare current versus proposed parameter settings and quantify the deviation
- Tune calculation methods and smoothing per XYZ classification and service level
- Identify SKUs with suboptimal parameter configurations
Filters & slicers
| Filter | What it does |
|---|---|
| Client, Location, Item (Category), ABC-XYZ Group | Scope the optimization to a company, location, item set or classification segment. |
| Target Item Availability (SLA) | The desired in-stock probability / service level driving the safety-factor (z-score). |
| Demand & Lead-Time Statistic, LeadTime to Use, Calc. Method (X/Y/Z) | Choose which statistical demand and lead-time measures and calculation methods to apply per classification. |
| EWMAxW Alpha / Weeks, New Parameter | Configure exponential smoothing (alpha and week window) so recent demand and lead-time changes are reflected. |
Visuals on this page
Parameter Comparison Table
A table per SKU with the proposed New Safety Stock and New Reorder Point, their deviation to the current ERP parameters, and the lead time used for the calculation.
- See proposed versus current safety stock and reorder point at a glance
- Focus on SKUs with the largest deviation from current settings
Demand Statistics
Historical weekly demand analysis - average, median and max weekly demand, standard deviation and the EWMA smoothing - shown as a table and a weekly demand chart (HistoricDemand vs. the statistical measures).
- Understand demand level and variability per SKU
- See how smoothing reflects recent demand changes
Lead Time Analysis
Lead-time statistics (BC, average, max and EWMAxW lead time in days) as a table plus a lead-time development column chart.
- Assess supplier / production lead-time reliability
- Choose the lead time used for the safety-stock and reorder-point calculation
Service Level Settings
Slicers for the target item availability (SLA) and the resulting safety factor (z-score), driving the statistical calculation.
- Set the desired service level per analysis
- See how the safety factor changes the proposed parameters
Typical use cases
- Safety-Stock Optimization — Identify items where safety stock can be reduced without hurting service, or increased to prevent stockouts.
- Service-Level Alignment — Ensure parameters align with target service levels for different item classifications.
- Working-Capital Reduction — Right-size safety stock based on actual demand patterns and lead times to free up capital.
- Parameter Maintenance — Establish a systematic process for reviewing and updating SKU parameters as demand patterns change.
Related KPIs
- New Safety Stock
- New Reorder Point
- LeadTime(Days) Avg
- WeeklyDemand Avg
- WeeklyDemand StdDev
See the full KPI & measure catalog for definitions and formats.
Back to all Demand Planning standard reports · Semantic model · Key business questions