Item Analysis
Transaction-level validation of movements and statistical lead-time analysis for procurement.
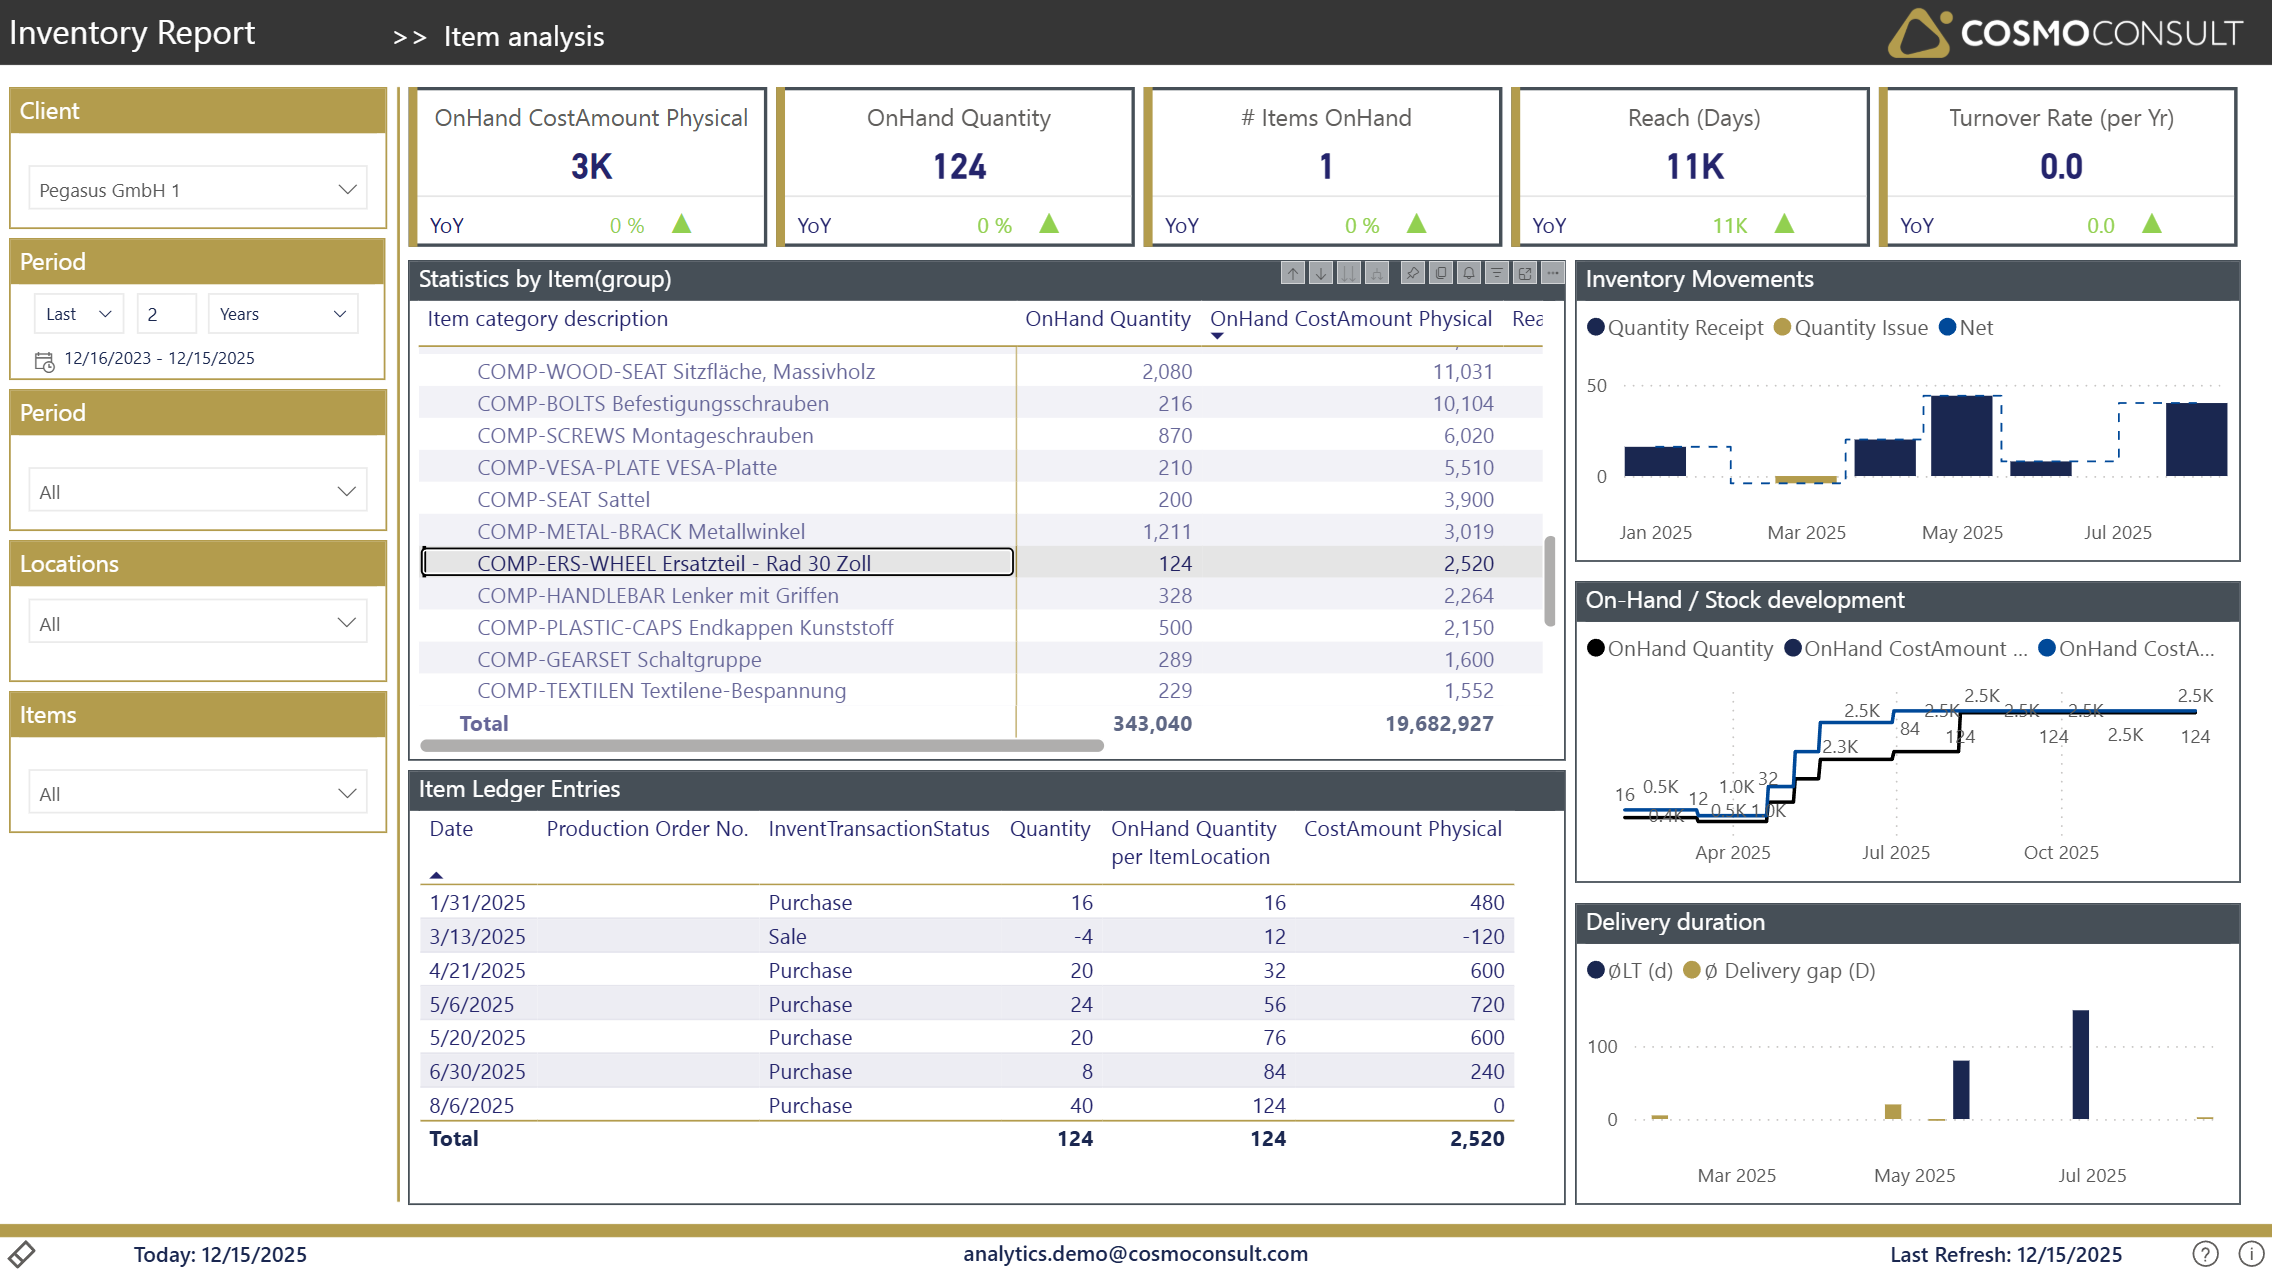
Drill from an item to its individual ledger entries to validate movements, and review statistical lead times and delivery gaps to sanity-check the lead-time parameters maintained on the SKU cards.
At a glance
Generated from the report definition (Artikelanalyse / Artikelanalyse).
- Key visuals: column chart, line chart, lineStackedColumnComboChart, matrix, table
What this report helps you do
- Analyze detailed item ledger entries and validate transactions
- Calculate and review statistical lead times for procurement
- Monitor inventory movements at the transaction level
- Identify patterns in receipt and issue transactions
Filters & slicers
| Filter | What it does |
|---|---|
| Client, Period (date / year / month), Location, Item (Category) | The same global slicers as the Overview page, applied to the item-level analysis. |
Visuals on this page
KPI Summary Tiles
OnHand CostAmount Physical, OnHand Quantity, # Items OnHand, Reach (Days) and Turnover Rate (per Yr) for the selected items.
Item & Category Selection Table
A table of items and categories (ItemCategory, Item, OnHand Quantity, OnHand CostAmount Physical, Reach (Days), average delivery duration) used to filter the ledger entries below - click an item to focus all other visuals.
- Pick an item or category to drive the detailed transaction view
- Compare reach and delivery duration across items
Item Ledger Entries (Detail Table)
A transaction-level table with Posting Date (DateBK), Production Order No., Transaction Status, Quantity (positive receipts / negative issues), OnHand Quantity per ItemLocation and Cost Amount Physical.
- Verify that inventory movements are recorded correctly
- Investigate discrepancies or unexpected transactions
Statistical Lead Time Analysis
A column chart of average lead time (LeadTime(Days) Avg) and the average delivery gap to the promised date per period.
- Validate and optimize the lead-time parameters maintained on SKU cards
- Detect suppliers or items with unreliable delivery performance
Typical use cases
- Transaction Validation — Verify inventory movements and investigate unexpected transactions or discrepancies.
- Lead-Time Validation — Compare statistical lead times and delivery gaps against maintained SKU parameters.
- Audit Support & Root-Cause Investigation — Provide a detailed transaction history and drill into an item to understand why stock or value changed.
Related KPIs
- LeadTime(Days) Avg
- Avg Delivery Gap to Promised Date (days)
- Reach (Days)
- OnHand Quantity
- OnHand CostAmount Physical
See the full KPI & measure catalog for definitions and formats.
Back to all Demand Planning standard reports · Semantic model · Key business questions