By Item
An item-centric view on inventory, to manage the product portfolio and spot slow and fast movers.
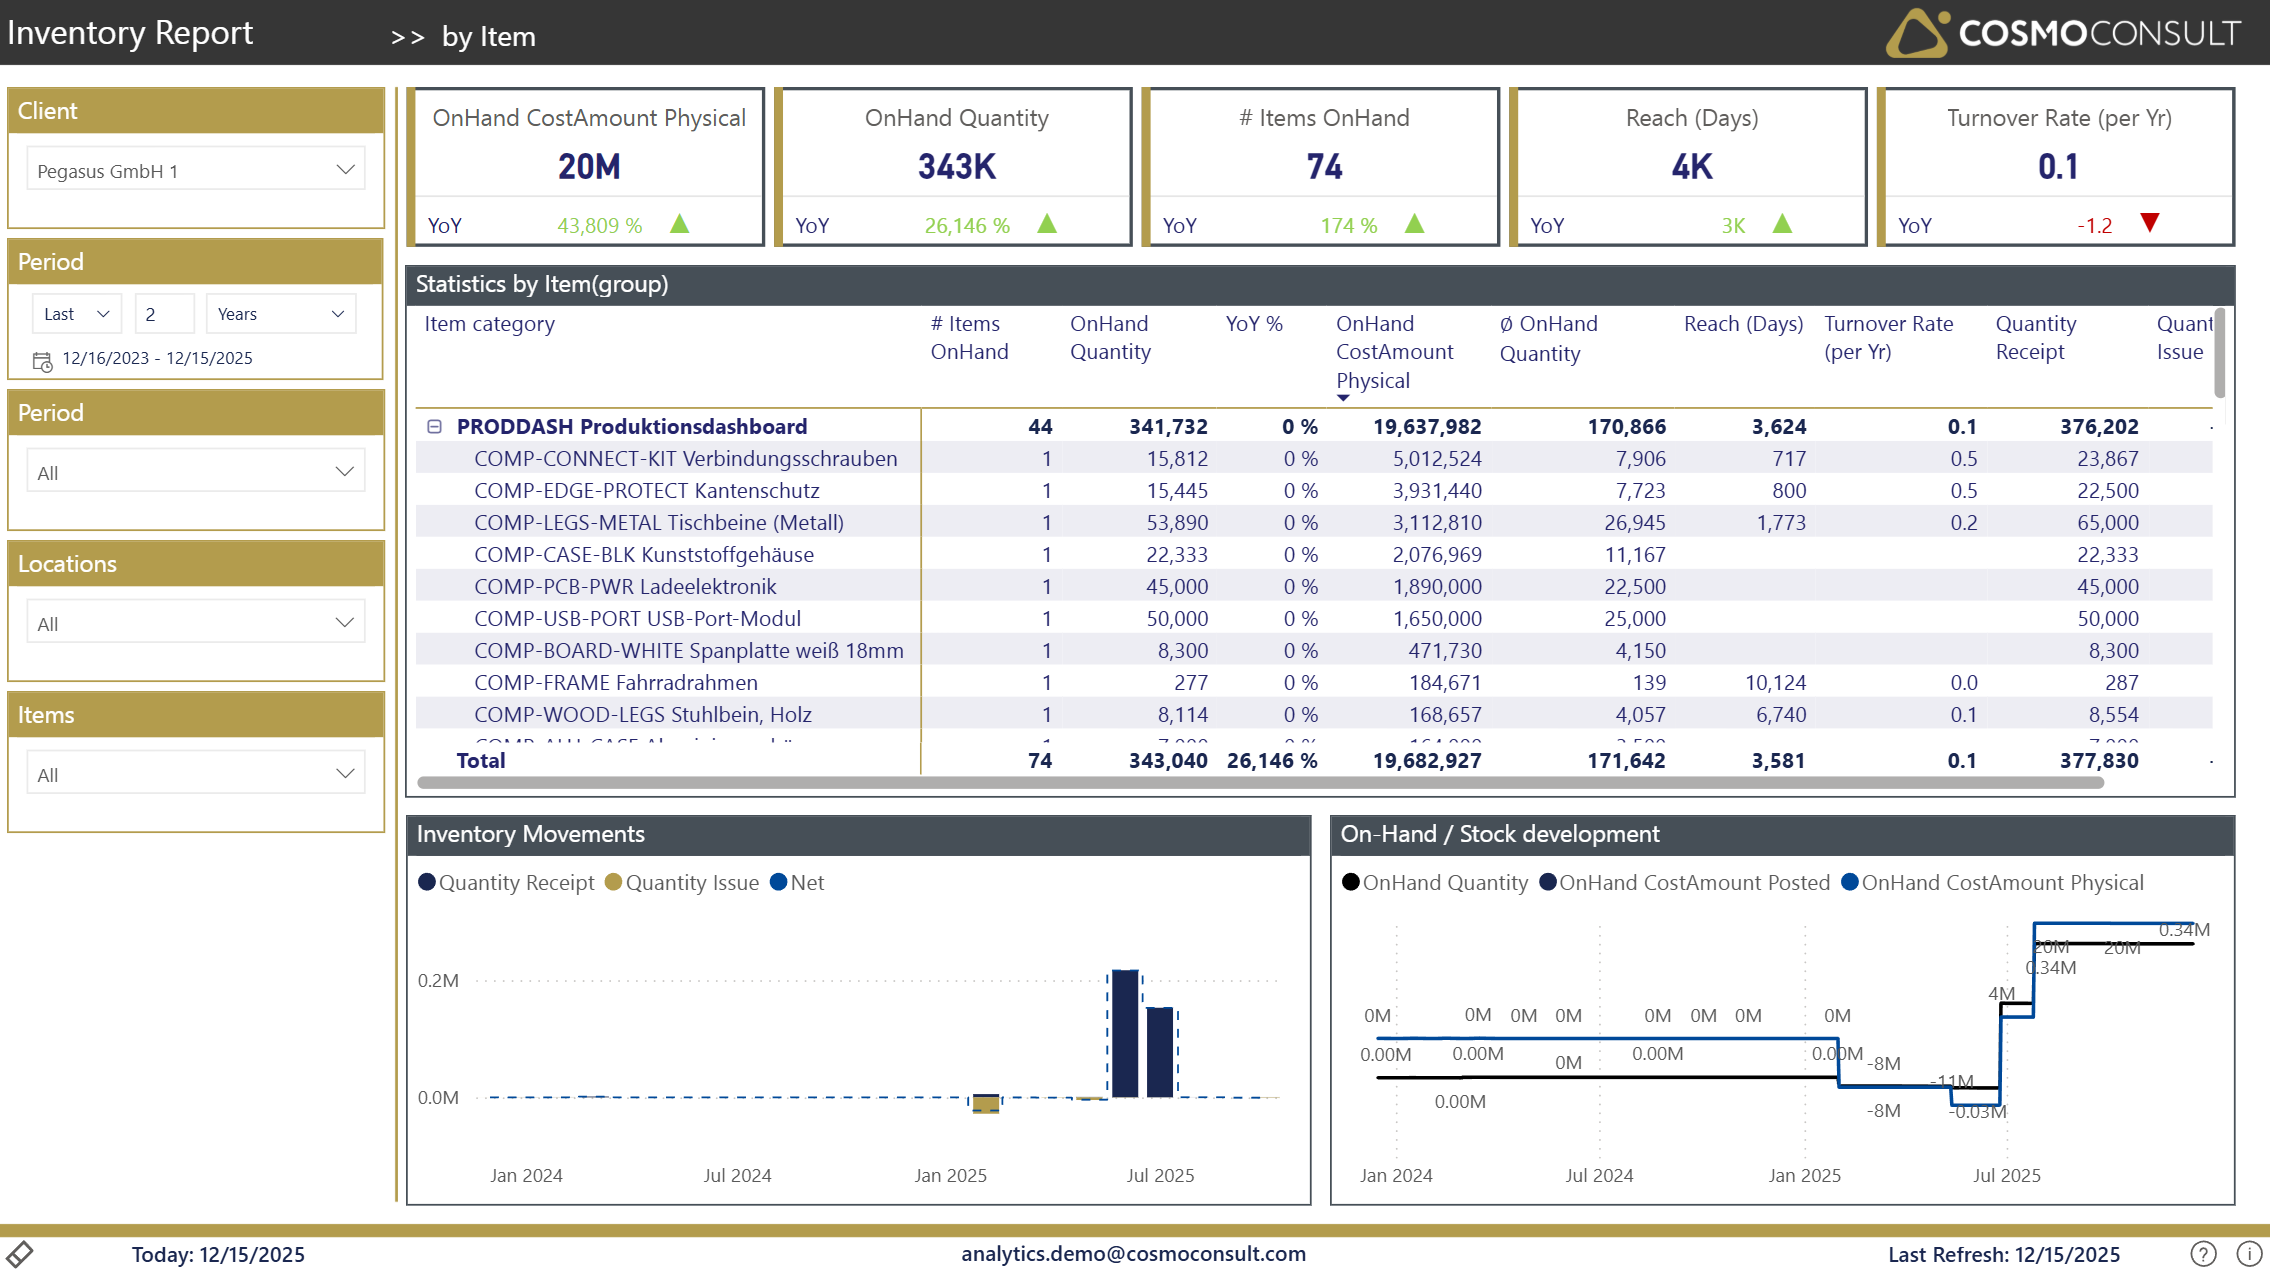
Analyse stock, value, movements, reach and turnover per item or item group to separate fast movers from slow movers, and select an item to reveal its full supply-chain pattern of receipts and issues.
At a glance
Generated from the report definition (Artikelbewegungen / Artikelbewegungen).
- Key visuals: line chart, lineStackedColumnComboChart, matrix
What this report helps you do
- Analyze individual item performance and trends
- Identify slow-moving items with excessive stock and fast movers at stockout risk
- Monitor item-specific inventory value and reach
- Reveal the receipt/issue supply-chain pattern for a selected item
Filters & slicers
| Filter | What it does |
|---|---|
| Client, Period (date / year / month), Location, Item (Category) | The same global slicers as the Overview page, applied to the item-level analysis. |
Visuals on this page
KPI Summary Tiles
OnHand CostAmount Physical, OnHand Quantity, # Items OnHand, Reach (Days) and Turnover Rate (per Yr) for the selected items.
On-Hand / Stock Development
A line chart of OnHand Quantity and inventory value over time for the selected item(s).
- Follow how an item's stock and value evolve together
- Spot build-ups or depletions for specific items
Inventory Movements
A combined column/line chart of Quantity Receipt, Quantity Issue and on-hand Quantity per month, revealing the supply-chain pattern of a selected item.
- See how receipts and issues drive an item's stock level
- Identify irregular or seasonal replenishment patterns
Statistic by Item (Detail Table)
A table broken down by ItemCategory and Item with # Items OnHand, OnHand Quantity (and YoY %), OnHand CostAmount Physical, average on-hand quantity, Reach (Days), Turnover Rate (per Yr), Quantity Receipt and Quantity Issue.
- Sort by Reach (Days) descending to detect slow movers and overstockings
- Rank items by turnover to separate fast and slow movers
Typical use cases
- Slow-Mover Identification — Identify items with low turnover or excessive stock that may require clearance or reduced ordering.
- Fast-Mover Monitoring — Track high-velocity items to ensure adequate stock and avoid stockouts of critical products.
- Product Portfolio Review — Use turnover and reach metrics to steer assortment and discontinuation decisions.
Related KPIs
- OnHand Quantity
- OnHand CostAmount Physical
- Reach (Days)
- Turnover Rate (per Yr)
- # Items OnHand
See the full KPI & measure catalog for definitions and formats.
Back to all Demand Planning standard reports · Semantic model · Key business questions