By Location
A location-centric view on inventory, to balance stock across warehouses and distribution centers.
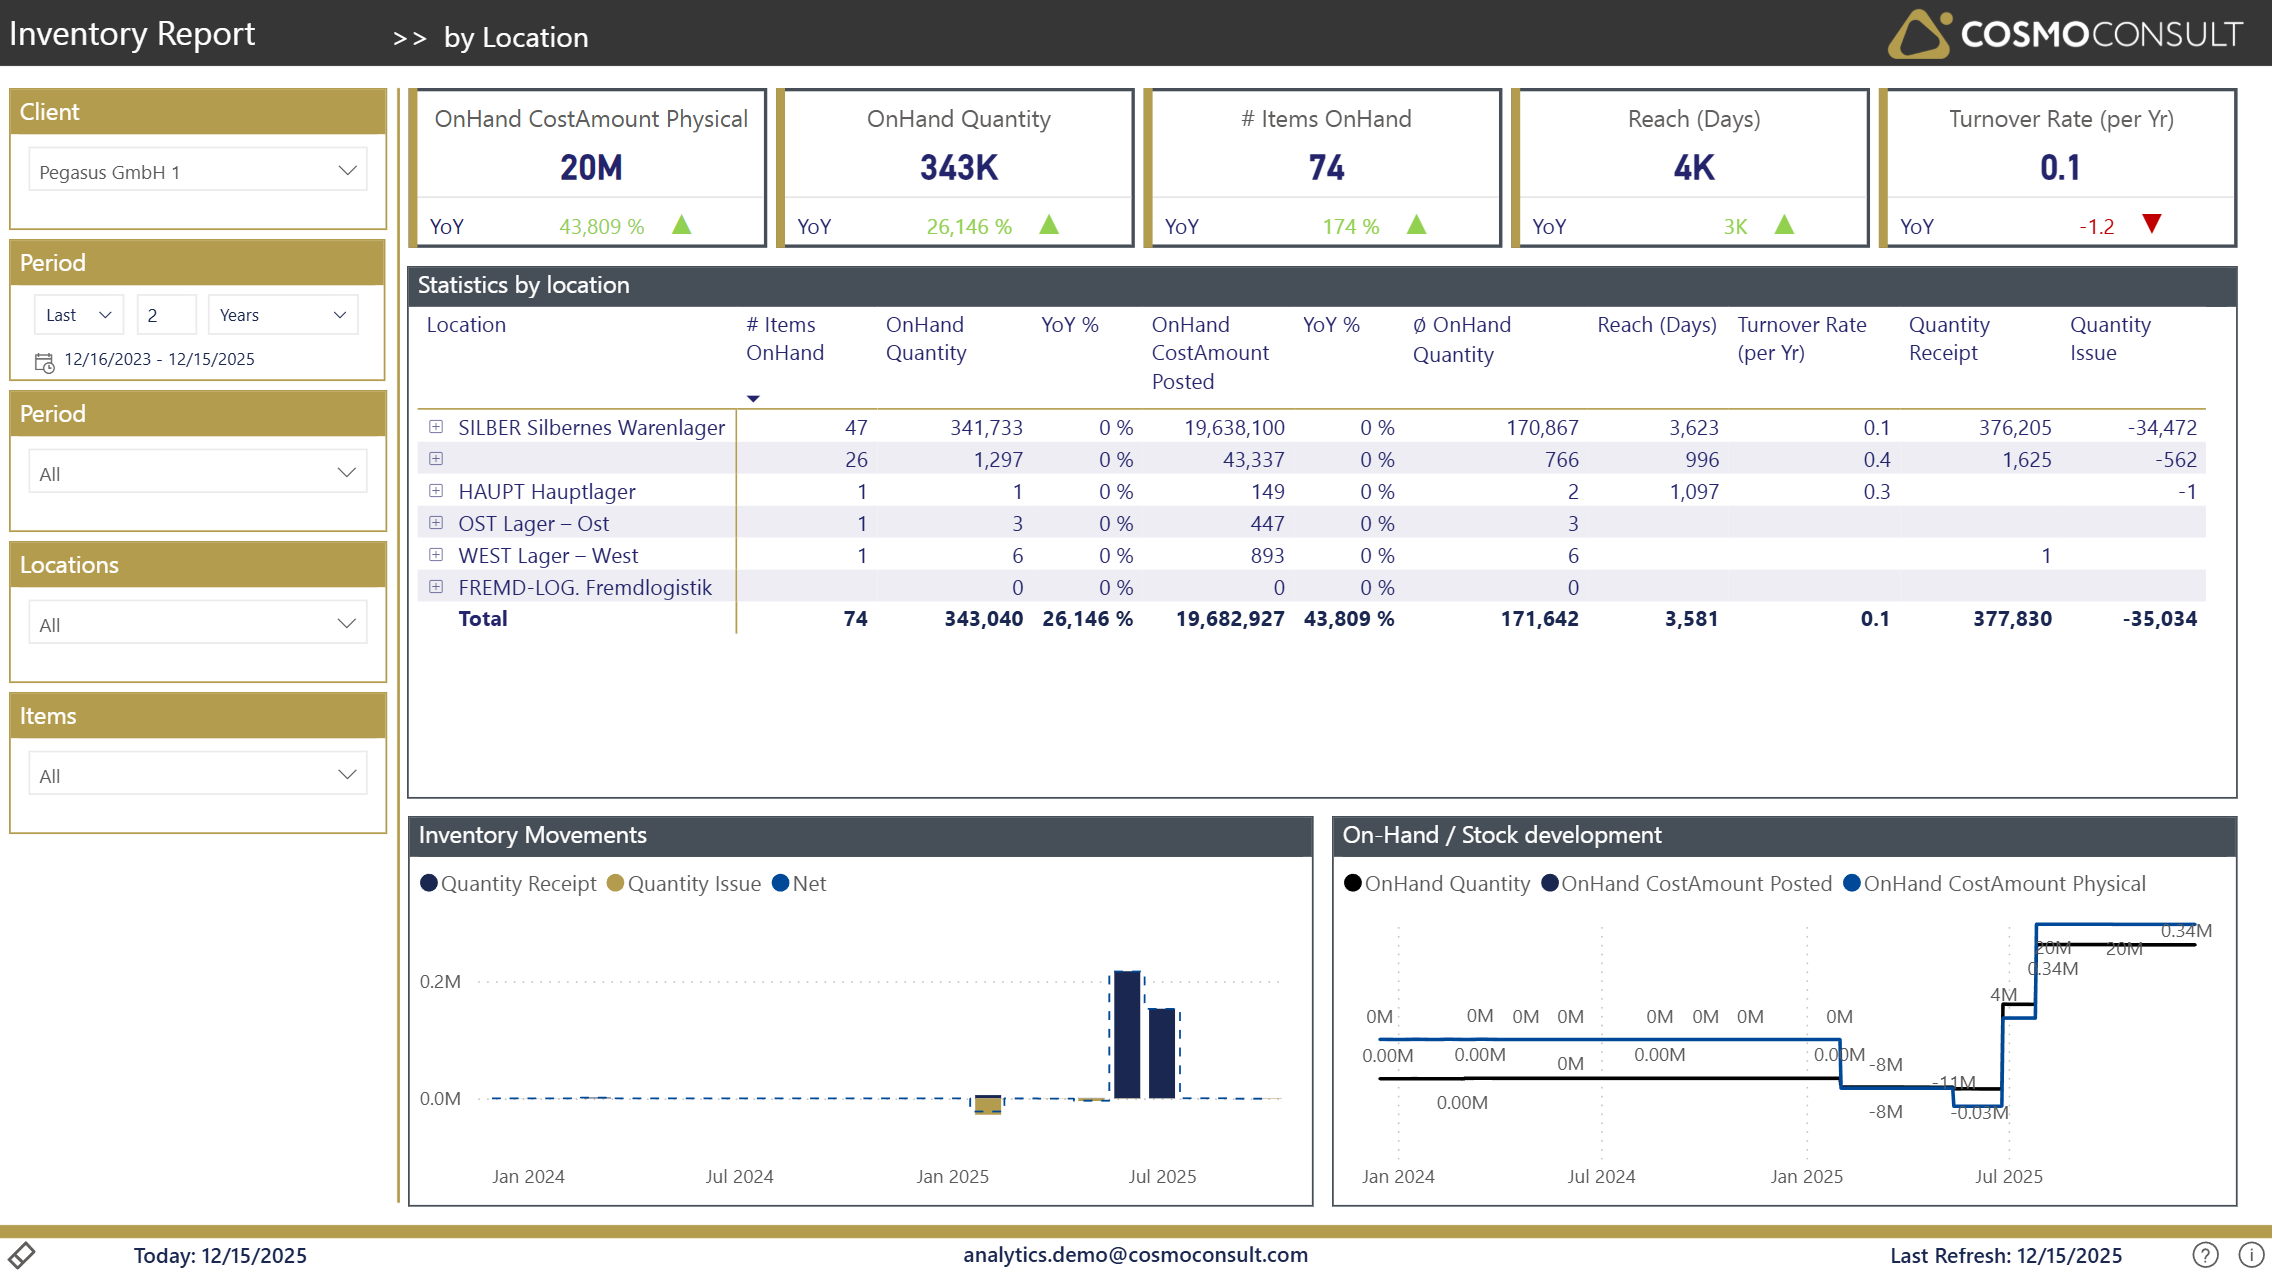
Break stock and value down by location, compare movements and on-hand development per site, and use the detailed table to see exactly how much of each item sits where - the basis for redistribution decisions.
At a glance
Generated from the report definition (Lagerorte / Lagerorte).
- Key visuals: line chart, lineStackedColumnComboChart, matrix
What this report helps you do
- See how on-hand quantity and value are distributed across locations
- Identify locations with stock imbalances or potential shortages
- Compare inventory turnover and reach across locations
- Focus movements and stock development on a single selected location
Filters & slicers
| Filter | What it does |
|---|---|
| Client, Period (date / year / month), Location, Item (Category) | The same global slicers as the Overview page, applied to the location-level analysis. |
Visuals on this page
KPI Summary Tiles
OnHand CostAmount Physical, OnHand Quantity, # Items OnHand, Reach (Days) and Turnover Rate (per Yr) for the selected locations.
On-Hand / Stock Development
A line chart of OnHand Quantity and inventory value over time that reacts to the selected location(s).
- See how stock and value develop for a chosen location
- Compare a location's trajectory against the overall picture
Inventory Movements
A combined column/line chart of Quantity Receipt, Quantity Issue and on-hand Quantity per month for the selected location(s).
- Understand inbound vs. outbound flows at a specific site
- Identify locations with imbalanced movements
Statistic by Location (Detail Table)
A table broken down by InventLocation and Item with # Items OnHand, OnHand Quantity (and YoY %), OnHand CostAmount Posted (and YoY %), average on-hand quantity, Reach (Days), Turnover Rate (per Yr), Quantity Receipt and Quantity Issue.
- Sort by reach or turnover to find over- or under-stocked items per location
- Compare year-over-year stock development across sites
Typical use cases
- Stock Distribution Analysis — Identify locations with excess stock or potential shortages to enable proactive redistribution.
- Location Performance Comparison — Compare turnover and reach across locations to spread best practices and find improvement areas.
- Working-Capital Optimization — Analyze how inventory value is distributed across the location network to optimize capital allocation.
Related KPIs
- OnHand Quantity
- OnHand CostAmount Physical
- # Items OnHand
- Reach (Days)
- Turnover Rate (per Yr)
See the full KPI & measure catalog for definitions and formats.
Back to all Demand Planning standard reports · Semantic model · Key business questions