Balance Sheet
A structured view of assets, equity and liabilities with liquidity and capital ratios.
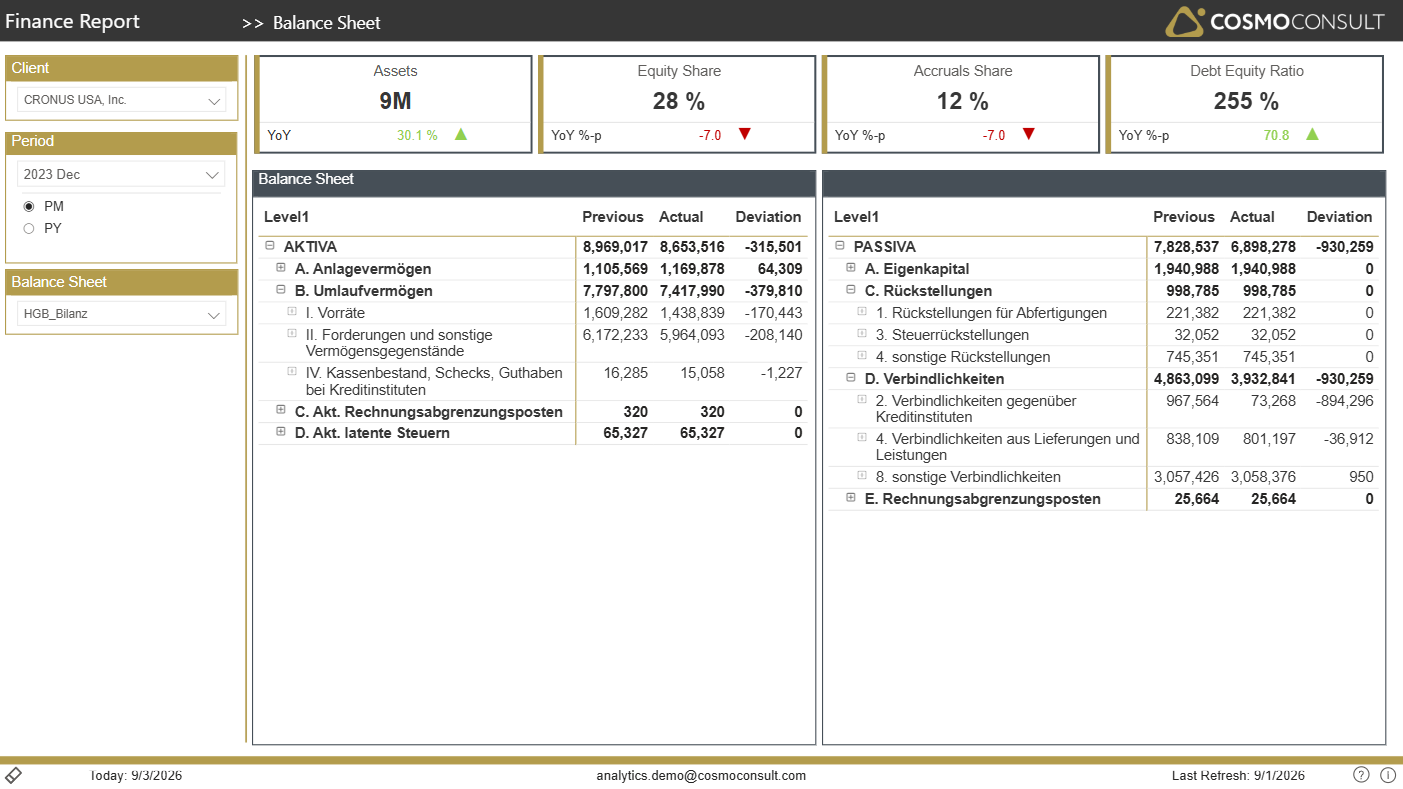
Read the balance sheet by structure, compare period-end figures against the prior period, and monitor the capital ratios (equity share, debt-equity, accruals share) that describe financial stability.
At a glance
Generated from the report definition (Bilanz / Balance Sheet).
- Key visuals: 2× matrix
What this report helps you do
- Read the balance-sheet structure - assets, equity, liabilities
- Compare period-end balances against the previous period
- Monitor capital ratios (equity share, debt-equity ratio, accruals share)
- Assess financial stability and capitalisation over time
Filters & slicers
| Filter | What it does |
|---|---|
| Client, Period | Restrict the balance sheet to specific companies and reporting dates. |
Visuals on this page
Balance Sheet Matrix
A hierarchical matrix lists balance-sheet positions with current and prior-period columns.
- Expand assets, equity and liabilities from totals to detail
- Compare each position against the previous period and its deviation
- Spot positions with material period-over-period movements
Structure & Ratio KPIs
Cards summarise the key balance-sheet ratios for the selected date.
- Equity Share and Debt Equity Ratio describe capitalisation
- Assets and Accruals Share frame the overall structure
Typical use cases
- Financial-Stability Review — Monitor capitalisation and liquidity ratios during reporting cycles.
- Period-over-Period Analysis — Explain material changes in balance-sheet positions between periods.
Related KPIs
- Amount Balance Sheet
- Assets
- Equity Share
- Debt Equity Ratio
- Accruals Share
See the full KPI & measure catalog for definitions and formats.
Back to all Finance standard reports · Semantic model · Key business questions