Finance Standard Reports
The Finance app ships with the pre-built Power BI reports below. Start with the Overview page, then drill into the specialized reports.
Reports in this module
| Report | What it covers |
|---|---|
| Overview (this page) | The central cockpit for monitoring overall financial performance based on Dynamics 365 Business Central general-ledger data. |
| Income Statement | A structured profit-and-loss view with actual, previous-year and budget comparison. |
| Accounts Report | A cost-centre and financial-dimension view of the income statement. |
| Income Statement by Month | The income statement spread across months to reveal seasonality and trends. |
| Balance Sheet | A structured view of assets, equity and liabilities with liquidity and capital ratios. |
| Cash Flow | Cash-flow analysis split into operating, investing and financing activities. |
| Account Balance | A ledger-account balance list (trial balance) for the selected period. |
| Account Balance by Month | The account balance list spread across months to trace balance development. |
| Account Movement | The postings behind an account balance, linking movements to statement lines. |
Overview
The central cockpit for monitoring overall financial performance based on Dynamics 365 Business Central general-ledger data.
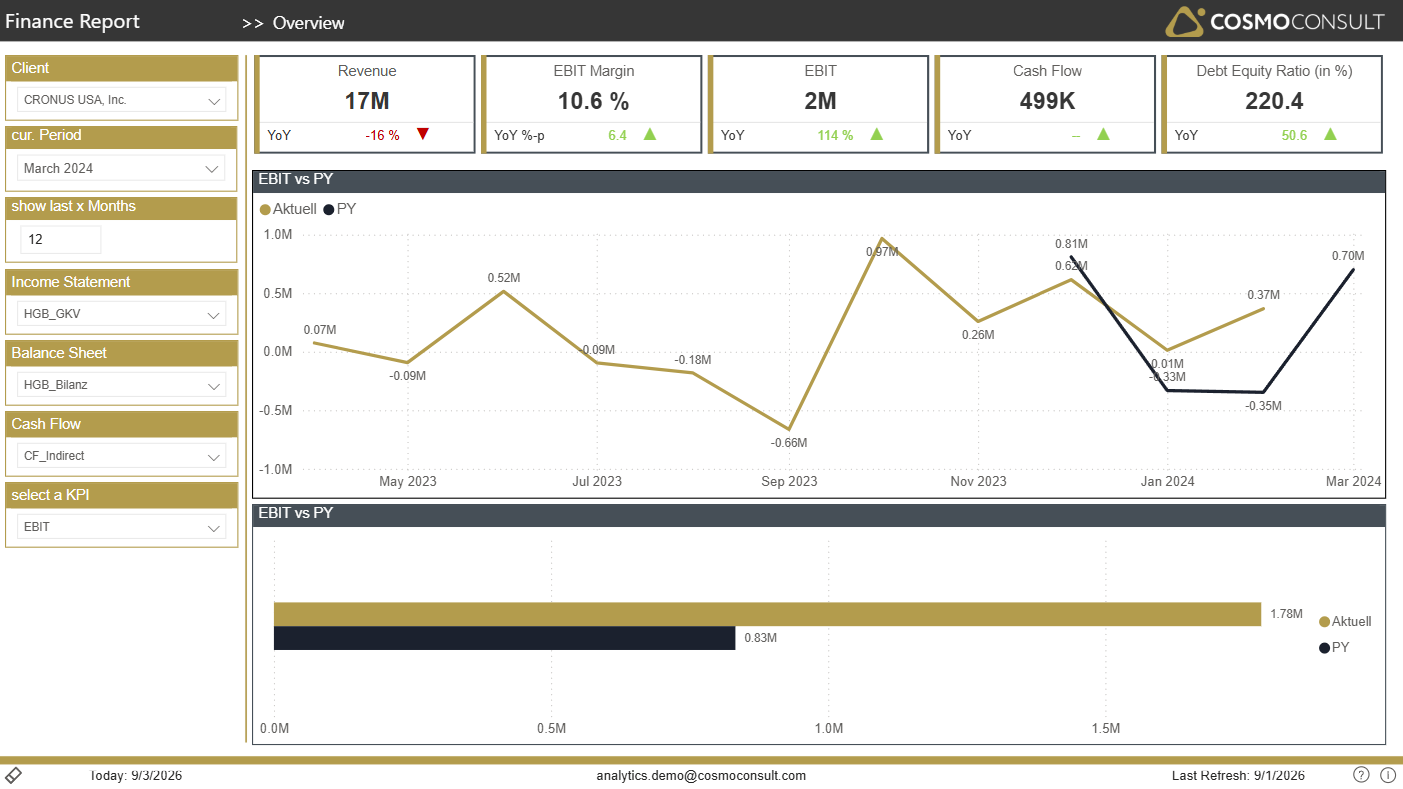
One management-level screen to see where the company stands financially: revenue and profitability, the most important margins and structural ratios, and how they develop versus the previous year - with a configurable KPI selector to focus on the metric that matters right now.
At a glance
Generated from the report definition (Überblick / Overview).
- Key visuals: bar chart, line chart
What this report helps you do
- Track headline financial KPIs (revenue, EBIT, margins, capital structure) in one place
- Compare current performance against the previous year at a glance
- Switch the highlighted KPI to focus on profit, margin or balance-sheet ratios
- Get an immediate sense of profitability and financial health before drilling in
Filters & slicers
| Filter | What it does |
|---|---|
| Client Selection | Focus on a single company or compare legal entities in multi-tenant scenarios. |
| Period Selection | Analyze a rolling time frame or zoom into specific months, quarters or fiscal years. |
| Last X Months | Restrict the trend to a rolling window (e.g. the last 12 months). |
| KPI Selector | Choose which KPI the trend chart and highlight visuals focus on. |
Using these filters consistently ensures that all KPIs and trends reflect the exact scope you want to analyse (e.g. a single company for the current fiscal year).
Visuals on this page
Top KPI Tiles
Gain a quick, management-level view of financial performance.
- Revenue shows the top line for the selected period.
- EBIT and EBIT Margin reveal operating profitability.
- Debt Equity Ratio (in %) summarises the capital structure.
- Each KPI is complemented by a YoY indicator for instant assessment versus last year.
KPI Trend
A line chart plots the selected KPI over time against the previous year.
- Identify seasonal patterns and structural trends in profitability
- Detect periods of under- or over-performance versus last year
- Evaluate the effect of pricing, cost or financing decisions over time
Typical use cases
- Management Financial Review — Use the page in recurring steering meetings to review overall financial health and trends.
- Early Warning — Quickly detect negative YoY deviations in profit or structure and initiate countermeasures.
- KPI Deep-Dive Entry Point — Start from the highlighted KPI and navigate into the statement pages for detail.
Related KPIs
- Revenue
- EBIT
- EBIT Margin
- Net income
- Debt Equity Ratio (in %)
See the full KPI & measure catalog for definitions and formats.