Income Statement
A structured profit-and-loss view with actual, previous-year and budget comparison.
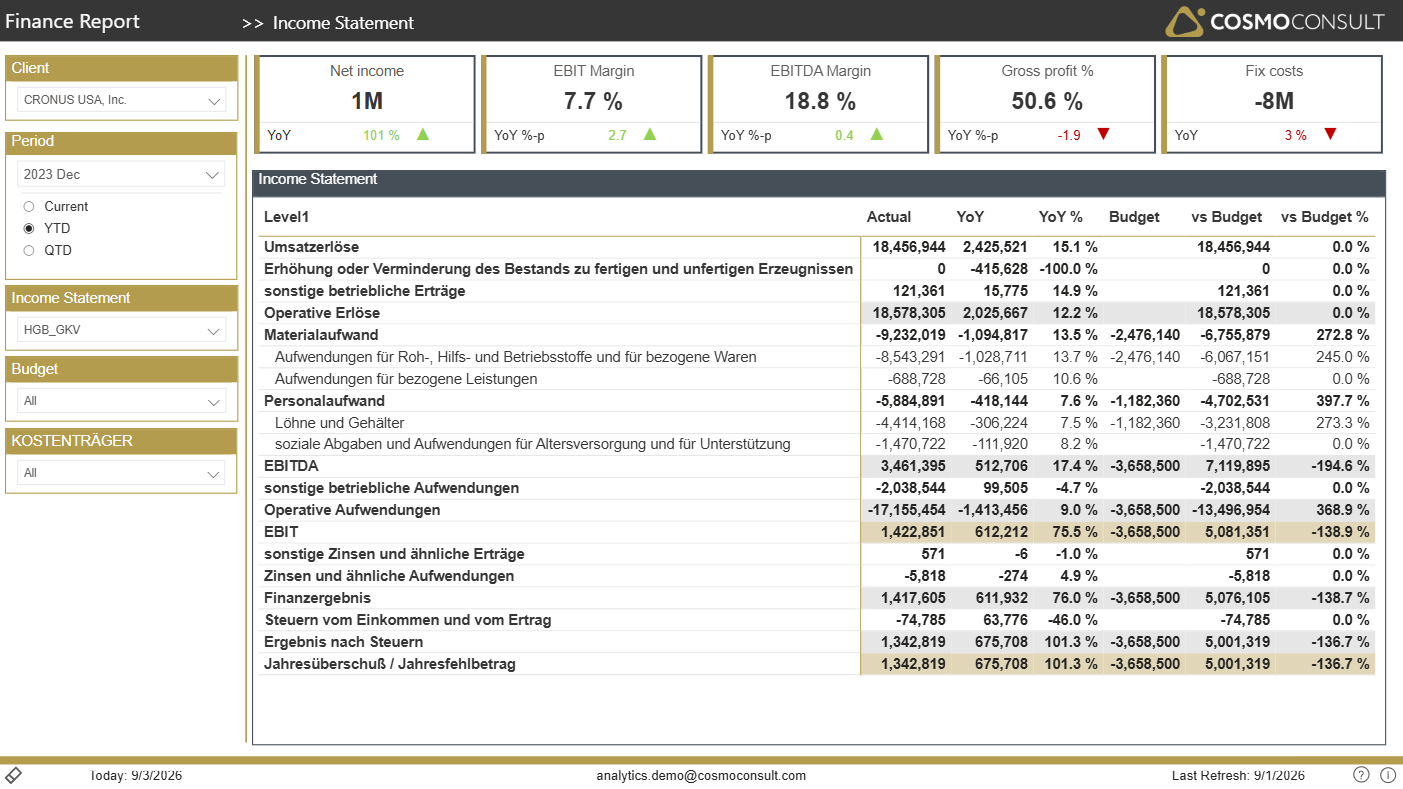
Read the full income statement from revenue down to net income, see each line item against last year and budget, and understand where profitability is won or lost - all with margin KPIs and variance indicators.
At a glance
Generated from the report definition (GuV / Income Statement).
- Key visuals: matrix
What this report helps you do
- Read the P&L structure from revenue to net income
- Compare each line item against the previous year and the budget
- Understand margin development (gross profit, EBITDA, EBIT)
- Pinpoint the line items that drive positive or negative variances
Filters & slicers
| Filter | What it does |
|---|---|
| Client, Period, Last X Months | Restrict the statement to specific companies, periods or a rolling window. |
Visuals on this page
Income Statement Matrix
A hierarchical matrix lists P&L line items with actual, previous-year and budget columns.
- Expand and collapse the statement hierarchy from totals to detail
- Read actual, previous-year and budget side by side per line item
- Spot line items with the largest absolute and relative variances
Margin KPIs
Cards summarise the key profitability margins for the selected scope.
- Gross profit %, EBITDA Margin and EBIT Margin at a glance
- Compare margins against the previous year via YoY indicators
Typical use cases
- Period Close Review — Review the P&L during month- and year-end close, focusing on budget variances.
- Profitability Analysis — Trace how gross profit converts into EBIT and net income to find margin leakage.
Related KPIs
- Actual Amount Income Statement
- Budget Amount Income Statement
- Gross profit %
- EBITDA Margin
- EBIT Margin
- Net income
See the full KPI & measure catalog for definitions and formats.
Back to all Finance standard reports · Semantic model · Key business questions