Income Statement by Month
The income statement spread across months to reveal seasonality and trends.
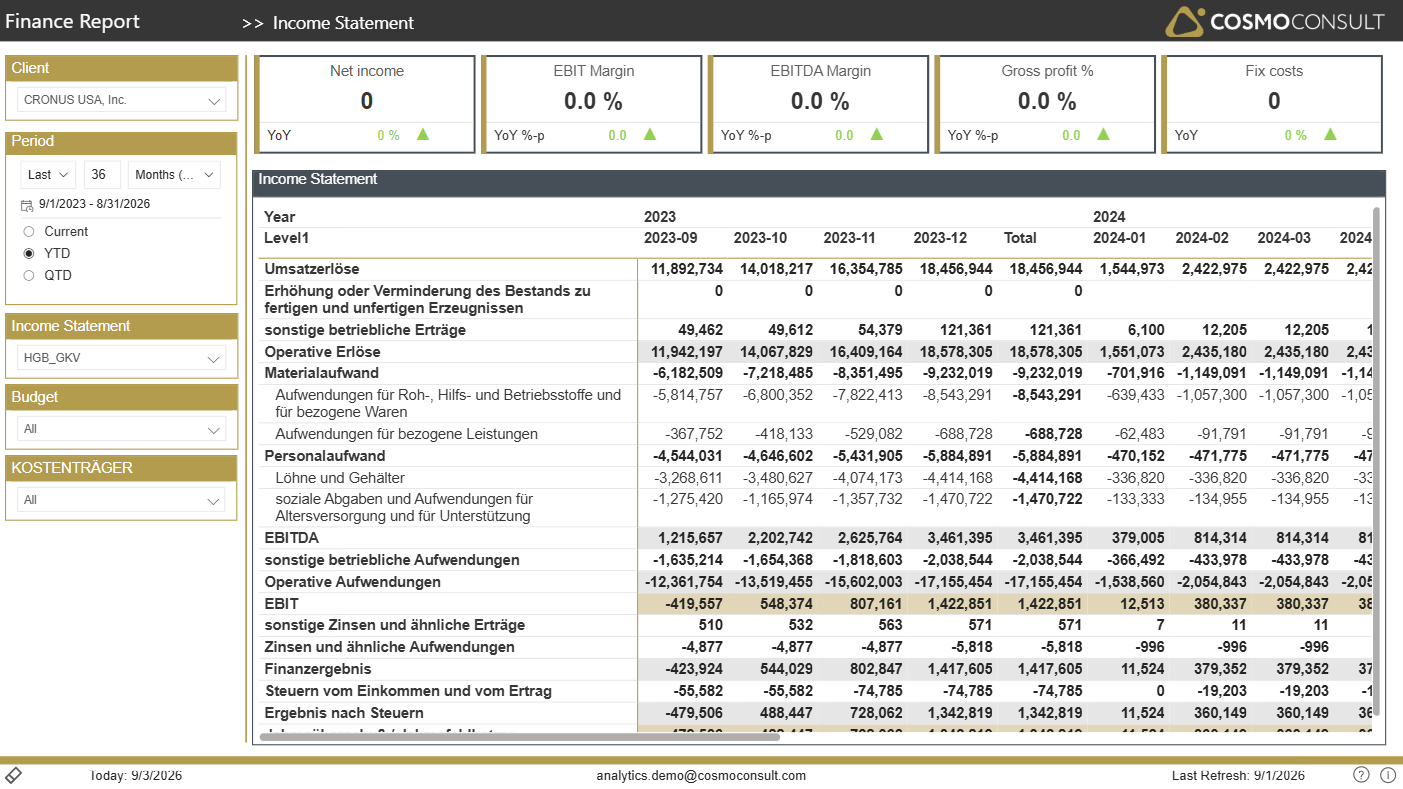
See how each P&L line item develops month by month across the fiscal year, making seasonality, one-off effects and structural trends immediately visible.
At a glance
Generated from the report definition (GuV monatlich / Income Statement by Month).
- Key visuals: matrix
What this report helps you do
- Track the monthly development of revenue, costs and profit
- Detect seasonality and one-off effects in the P&L
- Compare months to plan the remainder of the fiscal year
- Support rolling forecasts with a clear monthly baseline
Filters & slicers
| Filter | What it does |
|---|---|
| Client, Period, Last X Months | Restrict to specific companies, fiscal years or a rolling month window. |
Visuals on this page
Monthly Income Statement Matrix
A matrix places P&L line items in rows and months in columns.
- Read every line item across the months of the fiscal year
- Identify seasonal peaks and troughs in revenue and cost
- Spot months with abnormal results for closer investigation
Typical use cases
- Seasonality Analysis — Understand the seasonal pattern of revenue and cost to plan ahead.
- Forecast Support — Use the monthly baseline to build and validate rolling forecasts.
Related KPIs
- Actual Amount Income Statement
- Gross profit %
- EBITDA Margin
- EBIT Margin
See the full KPI & measure catalog for definitions and formats.
Back to all Finance standard reports · Semantic model · Key business questions