By Item
An item-centric view on procurement to manage the purchased portfolio based on facts.
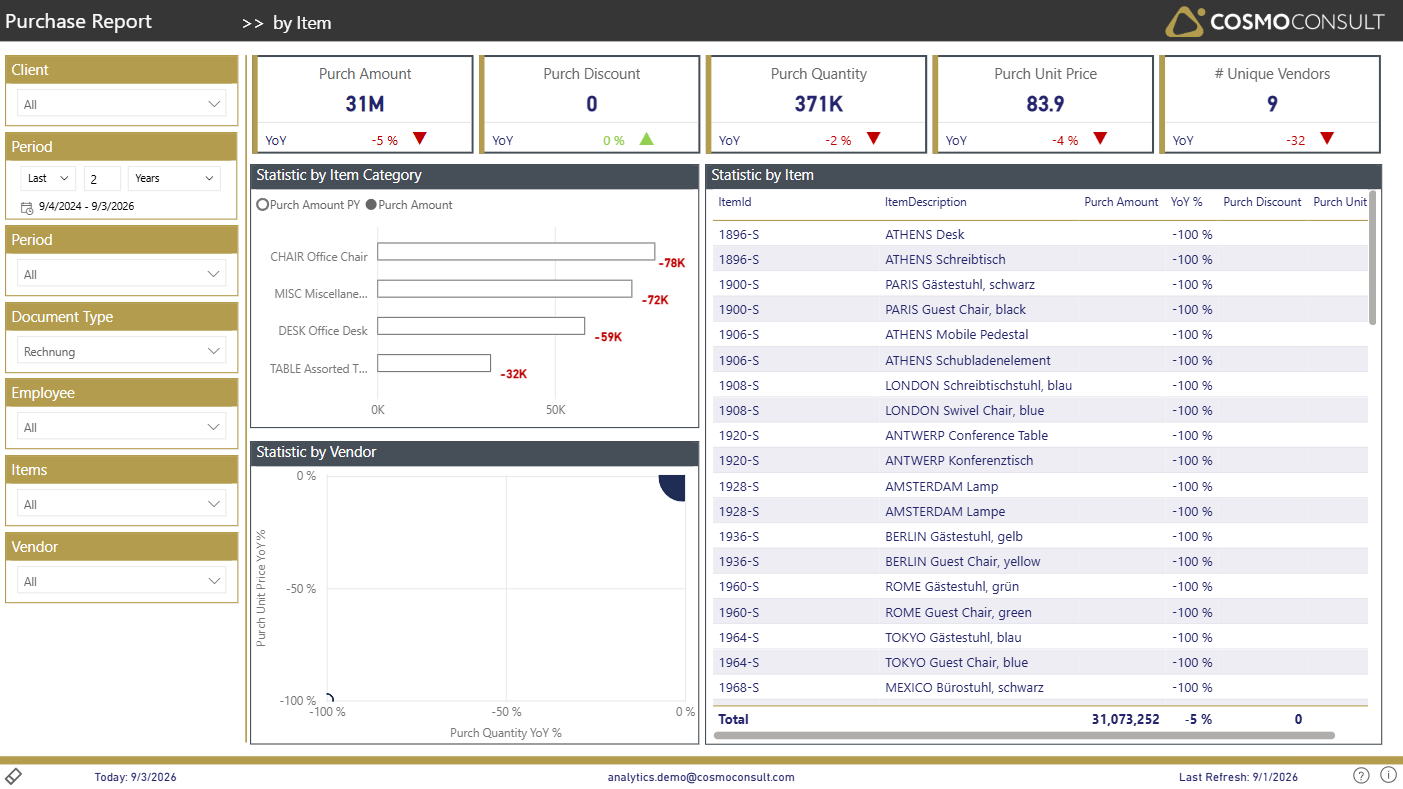
Understand which items and categories drive spend, how quantities and unit prices develop, and where discounts are won or lost - then drill through to the vendors behind each item.
At a glance
Generated from the report definition (by Item / by Item).
- Key visuals: bar chart, scatter chart, table
- Drill-through by: Vendor
What this report helps you do
- Identify top-spend products quickly for the selected period and document type
- Understand price and discount behaviour per item to support negotiation and pricing
- Detect shifts in product mix by comparing current vs. prior-year purchasing per category and item
- Prioritize portfolio actions (renegotiation, substitution, discontinuation)
- Assess supplier concentration risk by linking items to their vendors
Filters & slicers
| Filter | What it does |
|---|---|
| Client, Period (relative), Period (year), Document Type, Employee, Items, Vendor | The same global slicers as the Summary page, applied to the item-level analysis. |
Visuals on this page
KPI Summary Tiles
Purch Amount, Purch Discount, Purch Quantity, Purch Unit Price and # Unique Vendors for the selected items, each with a YoY indicator.
Statistic by Item Category
A horizontal bar chart showing Purch Amount and Purch Amount PY per item category.
- See which categories dominate overall spend for the selected period
- Compare current-year vs. prior-year purchasing per category to detect shifts
Statistic by Item (Detail Table)
A detailed item table with ItemId, ItemDescription, Purch Amount, YoY %, Purch Discount and Purch Unit Price.
- Rank items by spend, discount or price level
- Spot items with strong growth or decline versus last year
Statistic by Vendor
A scatter chart plotting the vendors that supply the selected items by Purch Quantity YoY % (x-axis) and Purch Unit Price YoY % (y-axis).
- Link item-level findings to specific suppliers
- Identify vendors with significant price or volume changes for the items under review
Drill-through & detail pages
by Vendor
Right-click an item to drill through to the vendor statistics for that specific item, revealing which suppliers drive its spend and price.
Typical use cases
- Top-Item Spend Analysis — Use the item table and category chart to identify high-spend items and categories for focused cost management.
- Price & Discount Review per Item — Analyze Purch Unit Price and Purch Discount at item level to detect unfavourable price development or unusual discount patterns.
- Category Portfolio Management — Compare current vs. prior-year spend per category to support expanding, maintaining or reducing product groups.
- Supplier-Item Relationship Analysis — Use the vendor scatter to understand which suppliers are critical for key items and manage supplier risk.
Related KPIs
- Purch Amount
- Purch Quantity
- Purch Unit Price
- Purch Discount
- Purch Discount %
See the full KPI & measure catalog for definitions and formats.
Back to all Purchase standard reports · Semantic model · Key business questions