Purchase Standard Reports
The Purchase app ships with the pre-built Power BI reports below. Start with the Summary page, then drill into the specialized reports.
Reports in this module
| Report | What it covers |
|---|---|
| Summary (this page) | The central cockpit for monitoring overall purchase performance based on Dynamics 365 Business Central data. |
| By Item | An item-centric view on procurement to manage the purchased portfolio based on facts. |
| By Vendor | A vendor-centric view on procurement, combining spend, volume and geographic information per vendor. |
| By Employee | Purchasing performance per buyer, to steer teams and individuals based on objective data. |
Summary
The central cockpit for monitoring overall purchase performance based on Dynamics 365 Business Central data.
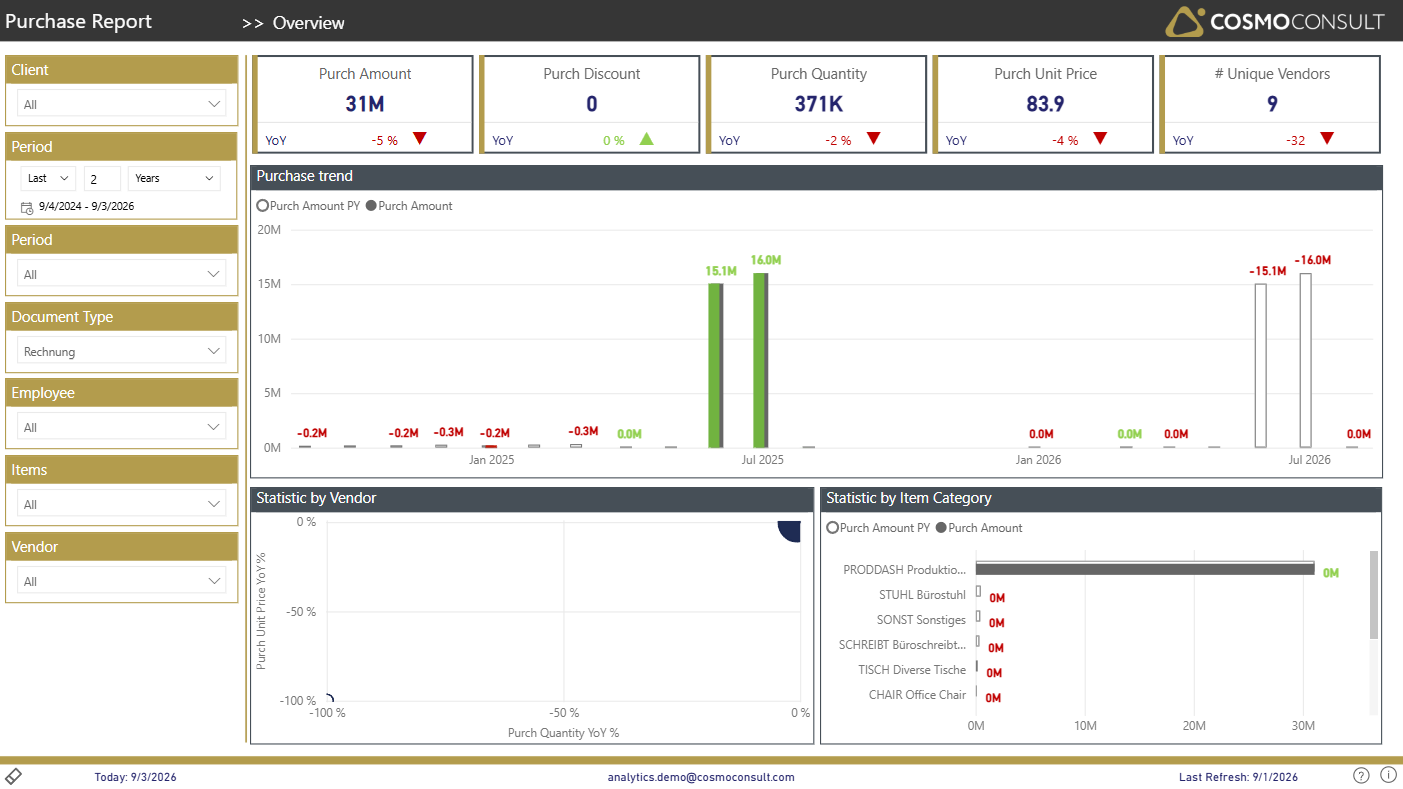
One management-level screen to see where procurement stands right now: total spend, discount, quantity and unit-price development versus last year, plus which vendors and item categories drive the spend.
At a glance
Generated from the report definition (Summary / Summary).
- Key visuals: bar chart, column chart, scatter chart
What this report helps you do
- Understand overall purchasing health quickly for the selected period and document type
- Recognize trends and seasonality in purchasing activity via the monthly trend
- See how spend is distributed across vendors and item categories to reveal concentration risks
- Decide where to investigate further - by item, vendor or employee on the dedicated pages
Filters & slicers
| Filter | What it does |
|---|---|
| Client | Selects the D365 BC company / tenant; compare entities in multi-tenant scenarios. |
| Period (relative) | Sets a relative time frame (e.g. Last 5 Years) and shows the corresponding date range. |
| Period (year) | Focuses the analysis on one or more specific calendar years. |
| Document Type | Filters the data by purchase document type (e.g. Invoice, Order, Receipt). |
| Employee | Evaluate purchasing results for individual buyers or teams. |
| Items | Restrict all KPIs and visuals to selected items or item categories. |
| Vendor | Focus on specific vendors or vendor segments. |
Using these filters consistently ensures that all KPIs, trends and breakdowns reflect the exact scope you want to analyse (e.g. spend of a specific buyer with a defined vendor portfolio in the last fiscal year).
Visuals on this page
KPI Summary Tiles
Gain a quick, management-level view of purchase performance.
- Purch Amount reveals total net purchase amount in the selected period.
- Purch Discount shows the absolute discount captured on purchases.
- Purch Quantity tracks the total quantity purchased.
- Purch Unit Price highlights the average unit price across all purchases.
- # Unique Vendors measures the number of active vendors in the period.
- Each tile includes a YoY indicator for instant assessment versus last year.
Purchase Trend
A monthly column chart compares actual purchase amount (Purch Amount) with the prior year (Purch Amount PY).
- Identify peaks, troughs and seasonality in purchasing
- See whether current purchasing is above or below last year for each month
Statistic by Vendor
A scatter chart plotting vendors by Purch Quantity YoY % (x-axis) and Purch Unit Price YoY % (y-axis); bubble size reflects relative importance.
- Detect vendors whose quantities and/or prices changed significantly year-over-year
- Spot vendors with rising prices or declining volumes
Statistic by Item Category
A horizontal bar chart contrasting Purch Amount and Purch Amount PY per item category.
- See which product groups drive total spend
- Compare current-year vs. prior-year purchasing per item category
Typical use cases
- Executive Purchasing Overview — Use the KPI cards and trend chart to assess whether amounts and quantities are on track versus last year and whether the supplier base is stable.
- Budget & Trend Monitoring — Monitor monthly developments and YoY comparisons to validate purchasing against budget or forecast and flag months that need deeper analysis.
- Structural Spend Analysis — Use the vendor scatter and item-category bar chart to understand where spend is concentrated and which vendors or categories show unusual YoY behaviour.
Related KPIs
- Purch Amount
- Purch Discount
- Purch Quantity
- Purch Unit Price
- # Unique Vendors
See the full KPI & measure catalog for definitions and formats.