By Employee
Sales performance per salesperson, to steer teams and individuals based on objective data.
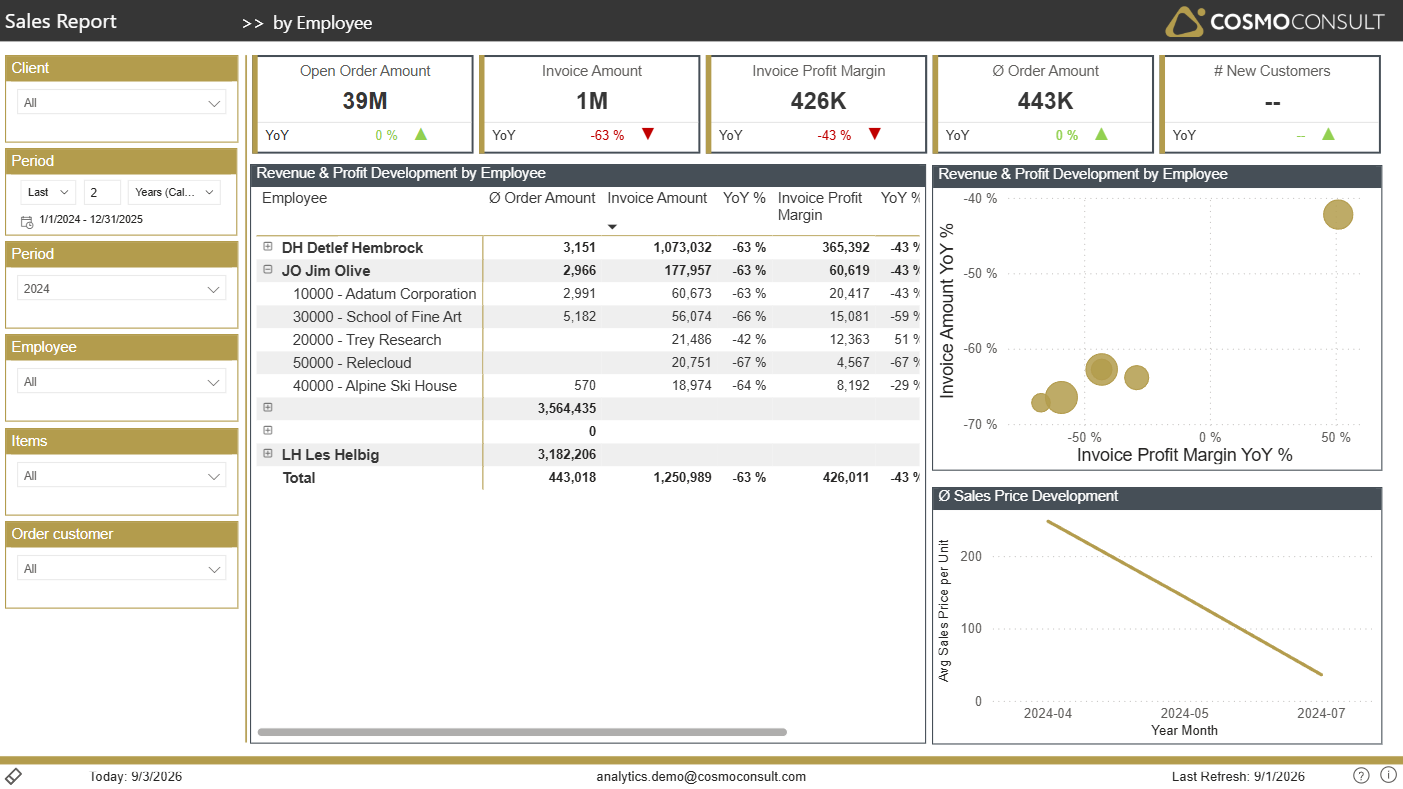
Compare revenue, profit and deal size across salespeople, spot aggressive discounting, and support target setting, incentives and coaching with fact-based KPIs.
At a glance
Generated from the report definition (Mitarbeiterauswertung / Analysis by Employee).
- Key visuals: line chart, matrix, scatter chart
What this report helps you do
- Compare sales and profit between employees or sales teams
- Understand how average order size differs across salespeople
- Track how each employee's performance develops compared to last year
- Support bonus, target setting and coaching discussions with fact-based KPIs
Filters & slicers
| Filter | What it does |
|---|---|
| Client, Period, Items, Order Customer | Evaluate an employee for a defined product portfolio or customer group, or compare teams across companies and years. |
Visuals on this page
Employee Performance Table
Aggregates core KPIs per employee - average order size, invoiced sales and YoY change, absolute profit and margin development.
- Rank employees by revenue, profit or margin
- Identify top performers and those needing support
- Recognize patterns such as high revenue but low margins (aggressive discounting)
Employee Performance Scatter
A scatter chart positions each employee by sales and margin change versus last year.
- See who is growing in both revenue and profitability
- See who maintains sales at the cost of margin
- See who is losing volume and profit, signalling territory or portfolio issues
Typical use cases
- Sales Team Steering — Review targets, highlight successes and address performance gaps in sales meetings.
- Incentive & Bonus Planning — Base variable compensation on transparent KPIs such as revenue growth and margin improvement.
- Coaching & Training — Identify employees who might benefit from pricing or negotiation training.
- Territory Realignment — Combine employee and customer insights to redistribute responsibilities for better market coverage.
Related KPIs
- Invoice Amount
- Invoice Profit Margin
- Ø Order Amount
- Average Invoice Amount
See the full KPI & measure catalog for definitions and formats.
Back to all Sales standard reports · Semantic model · Key business questions