Sales Standard Reports
The Sales app ships with the pre-built Power BI reports below. Start with the Overview page, then drill into the specialized reports.
Reports in this module
| Report | What it covers |
|---|---|
| Overview (this page) | The central cockpit for monitoring overall sales performance based on Dynamics 365 Business Central data. |
| By Customer | A 360° view on customer performance, combining sales, profit and regional information. |
| By Item | An item-centric view on sales performance to manage the product portfolio based on facts. |
| By Employee | Sales performance per salesperson, to steer teams and individuals based on objective data. |
| Items & Customers (Top/Flop) | A focused top-and-flop ranking of the items and customers that drive - or drag - your sales. |
| Sales Pipeline | The order-to-cash funnel from quote to invoice, with conversion at every stage. |
| Delivery Reliability | How reliably orders are delivered on time and in full - the ITIF perspective. |
| Overdue Orders | A working list of overdue orders and the revenue still waiting to be delivered. |
Overview
The central cockpit for monitoring overall sales performance based on Dynamics 365 Business Central data.
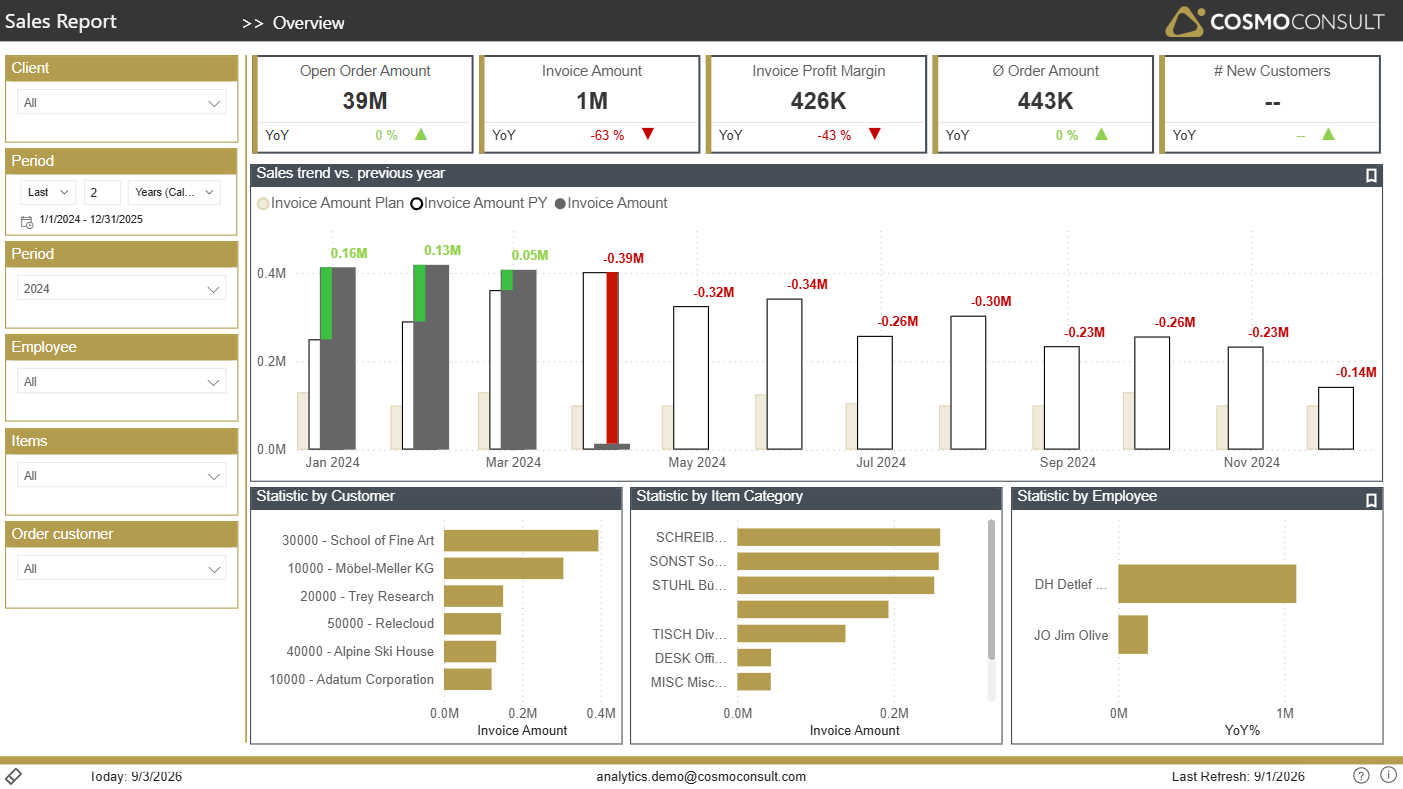
One management-level screen to see where sales stand right now: realized revenue and profit, the order backlog, development versus last year and plan, and which customers and product groups drive growth or decline.
At a glance
Generated from the report definition (Übersicht / Overview).
- Key visuals: area chart, 4× bar chart, 2× column chart, scatter chart
What this report helps you do
- Track the most important sales KPIs (orders, invoices, profit, new customers) in one place
- Compare actual performance against the previous year and, optionally, against plan
- Understand how sales develop over time at a monthly level
- Identify customers and product groups that drive growth or decline
Filters & slicers
| Filter | What it does |
|---|---|
| Client Selection | Focus on a single company or compare entities in multi-tenant scenarios. |
| Period Selection | Analyze a rolling time frame (e.g. last 2 years) or zoom into specific months. |
| Additional Period Filter | Select multiple periods (e.g. several months or years) to compare side by side. |
| Employee | Evaluate sales results for individual salespersons or teams. |
| Items | Restrict all KPIs and visuals to selected products or product groups. |
| Order Customer | Focus on specific customers or customer segments. |
Using these filters consistently ensures that all KPIs, trends and breakdowns reflect the exact scope you want to analyse (e.g. sales of a specific salesperson for a defined customer portfolio in the last fiscal year).
Visuals on this page
Top KPI Tiles
Gain a quick, management-level view of sales performance.
- Open Order Amount shows the current order backlog, supporting capacity and revenue forecasting.
- Invoice Amount reveals realized revenue in the selected period.
- Invoice Profit Margin highlights the absolute profit contribution.
- Ø Order Amount helps assess typical deal size.
- # New Customers measures customer acquisition dynamics.
- Each KPI is complemented by a YoY indicator for instant assessment versus last year.
Sales Trend vs. Plan and Previous Year
A monthly trend chart compares actual invoiced sales, previous year and planned amounts.
- Identify seasonal patterns and structural trends
- Detect months with under- or over-performance vs. plan
- Evaluate the effectiveness of sales initiatives over time
Customer Performance Bubble Chart
A scatter plot positions customers by sales growth and margin development.
- Spot high-potential customers with increasing revenue and margins
- Detect risk customers with declining sales and profitability
- Prioritize account-management actions based on factual performance
Item Category Performance
A bar chart contrasts invoice amounts and plan values per item category and highlights variances.
- See which product groups over- or underperform vs. expectations
- Identify categories where pricing or portfolio actions may be required
- Steer marketing or sales campaigns towards the most promising categories
Typical use cases
- Management Sales Review — Use the page in recurring steering meetings to review overall sales health, trends and plan fulfillment.
- Early Warning for Downturns — Quickly detect negative YoY deviations at total, customer or category level and initiate countermeasures.
- Campaign Evaluation — Compare periods before and after marketing or pricing campaigns to see their impact on revenue and profit.
- Budget & Forecast Monitoring — Contrast actual sales against planned values to monitor budget adherence and adjust forecasts.
Related KPIs
- Open Order Amount
- Invoice Amount
- Invoice Profit Margin
- Ø Order Amount
- # New Customers
See the full KPI & measure catalog for definitions and formats.