Quantitative Results by Month
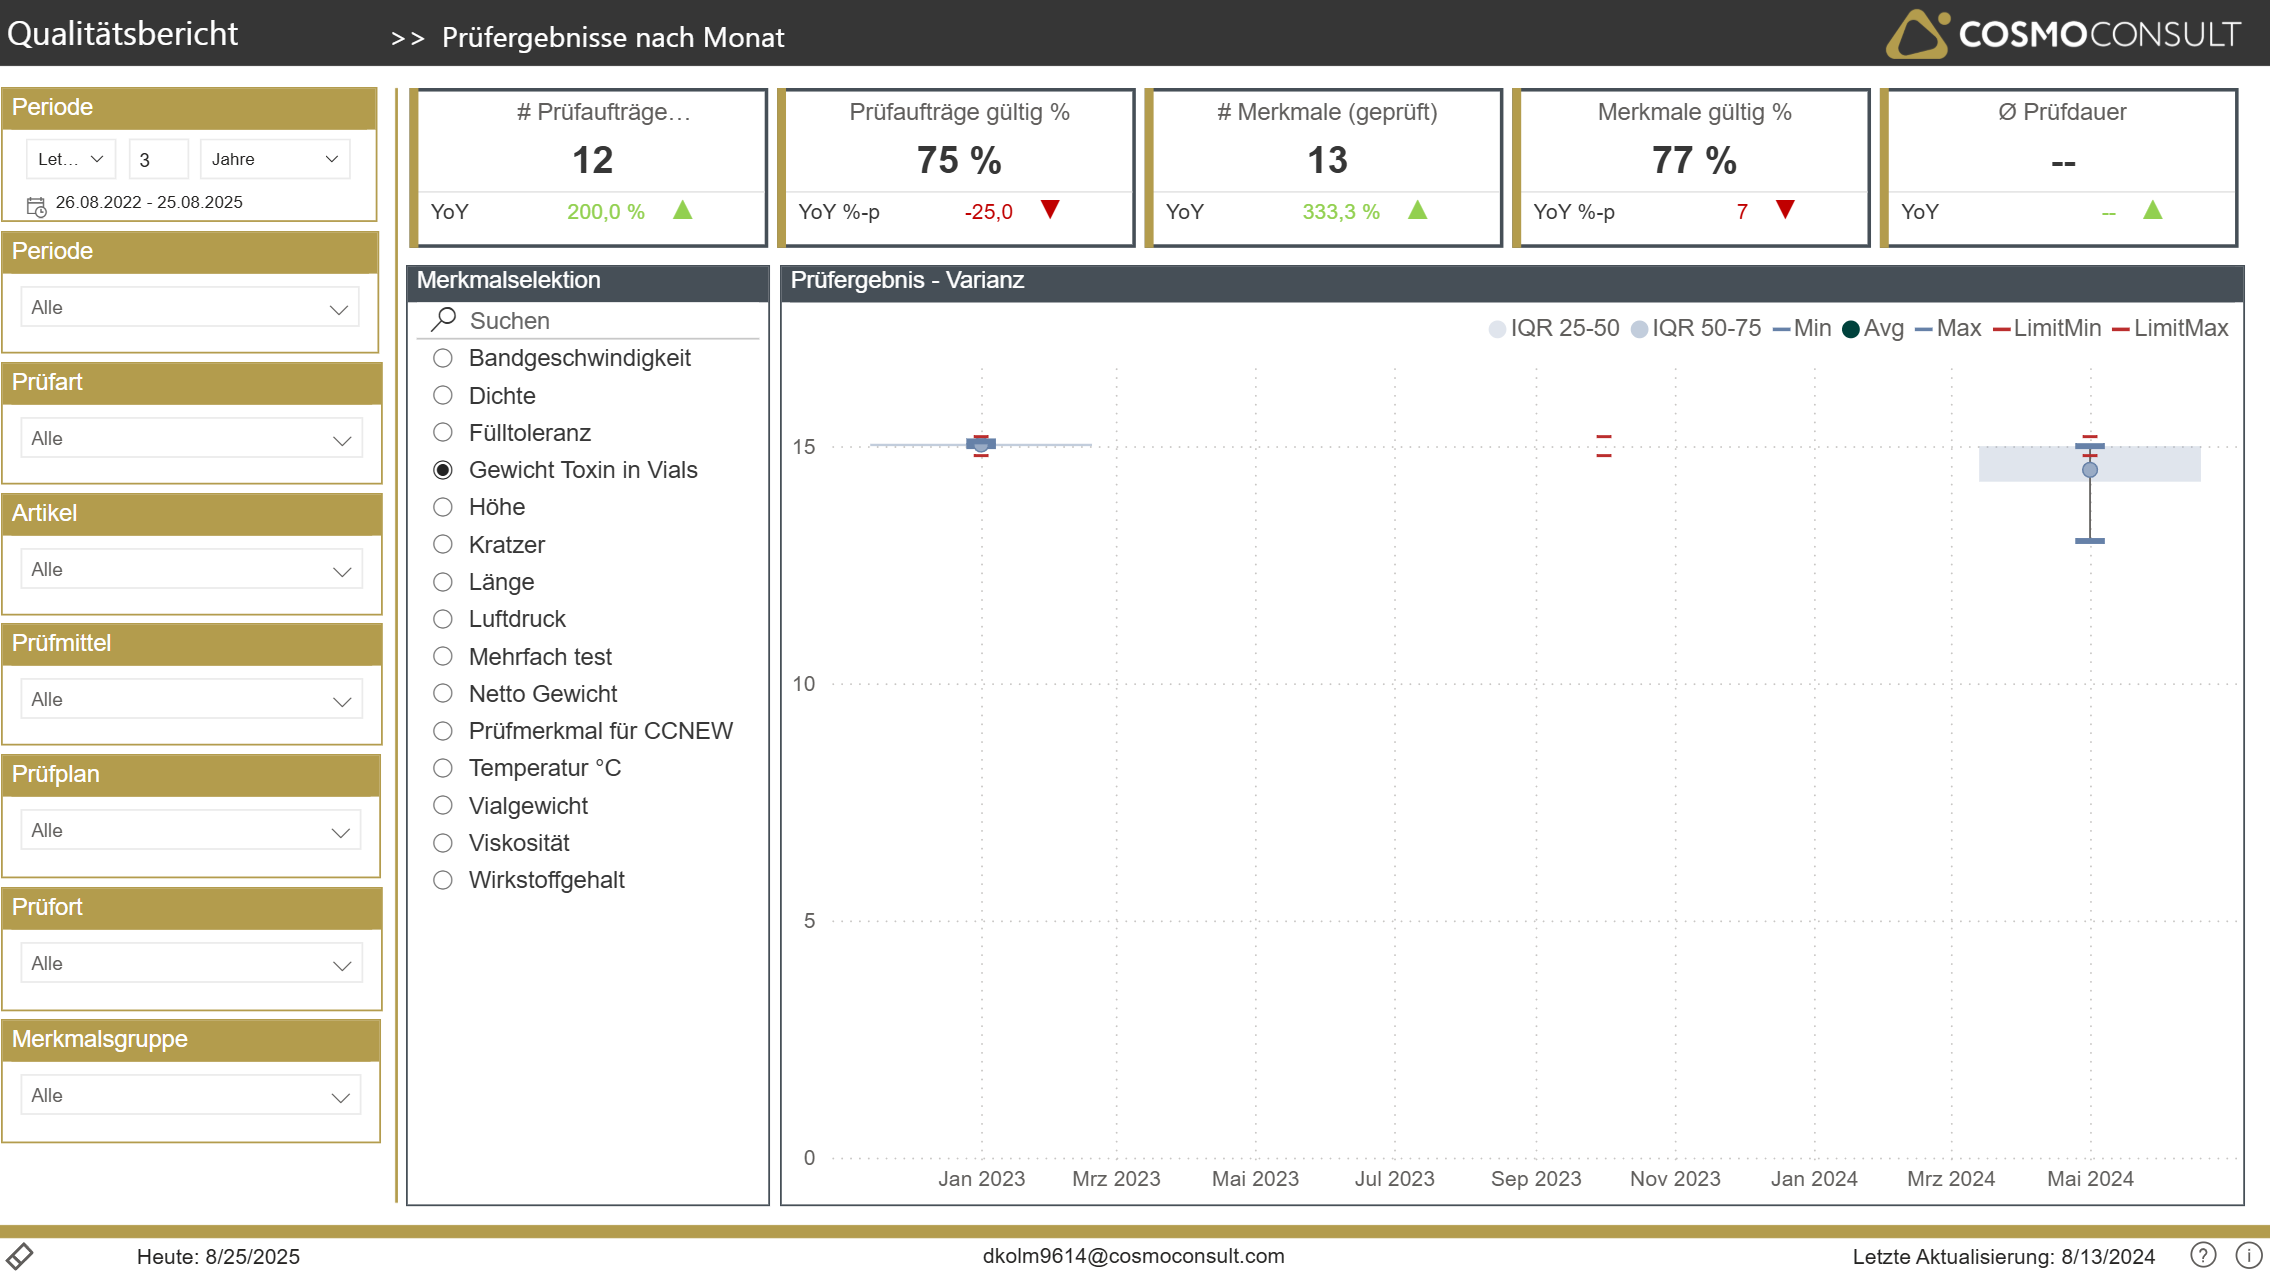
The Variance-Chart (Box-Plot) in this report provides the same details as Qualitative Results, however, should be used to analyze trends over time of one specific property. Hence, the option-slicer requires the selection of a single property for which the analysis should be made.
Use further slices on the left to narrow down your chart (e.g. by item).