Monthly Sales
Your monthly sales development against last year's run-up curve.
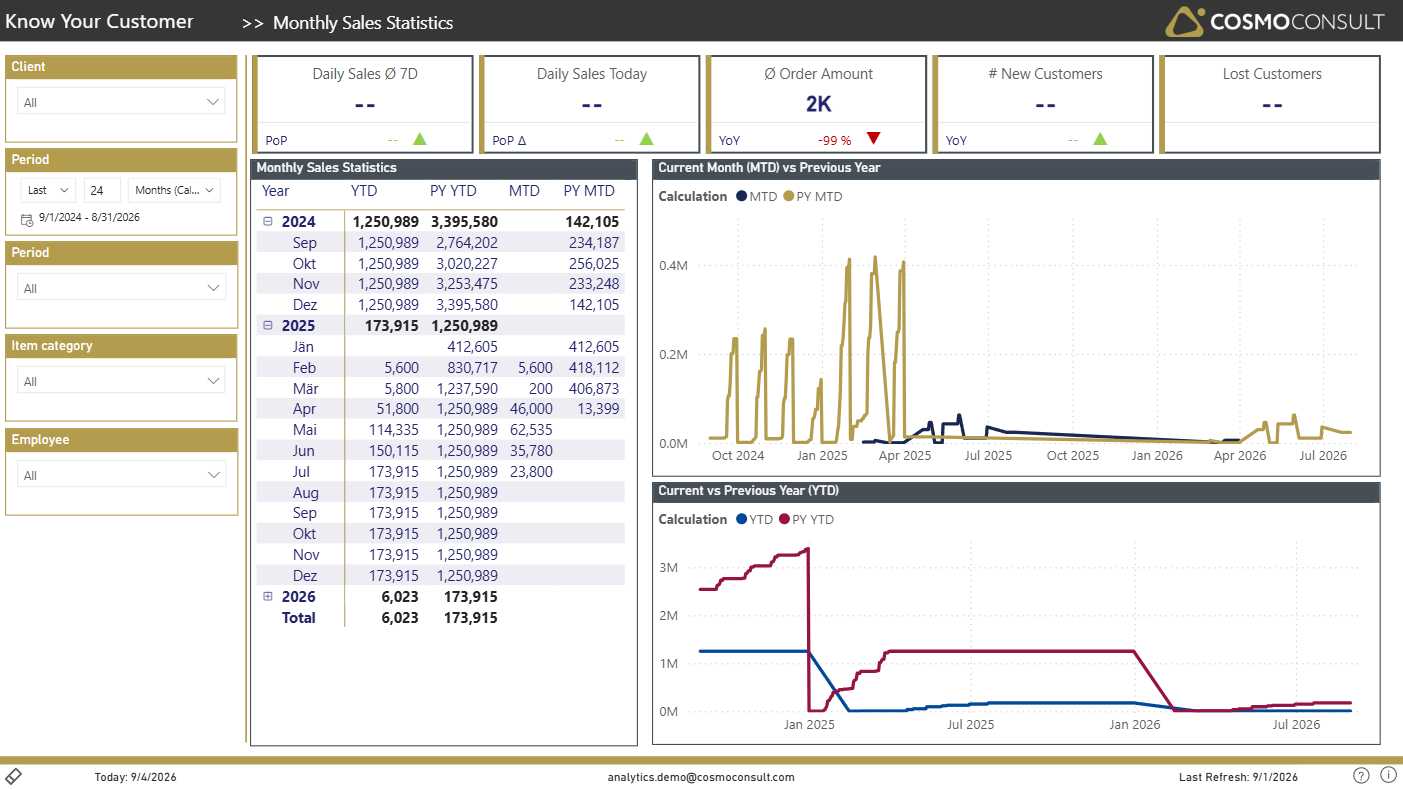
Analyze your monthly sales development and compare your month-to-date (MTD) curve to your run-up curve of the previous year, so you always know whether the current month is ahead of or behind last year at the same point in time.
At a glance
Generated from the report definition (MonthlySales / MonthlySales).
- Key visuals: 2× line chart, matrix
What this report helps you do
- Follow monthly sales development over time
- Compare the month-to-date curve to the previous-year run-up
- Judge whether the current month is on track versus last year
- Detect seasonal patterns and structural shifts
Filters & slicers
| Filter | What it does |
|---|---|
| Client, Period, Employee, Items | Focus the monthly view on a company, period range, salesperson or product portfolio. |
Visuals on this page
Monthly Development vs. Previous Year
A trend visual contrasts current invoiced sales with the previous year.
- Identify months that over- or under-perform versus last year
- Recognize seasonality across the year
Month-to-Date Run-up Curve
The MTD curve is compared against the previous year's run-up at the same day of month.
- See intra-month whether you are ahead of or behind last year
- Track how the gap to last year closes or widens through the month
Typical use cases
- Monthly Business Review — Assess monthly performance and MTD progress in the monthly sales review.
- Pace Tracking — Use the run-up comparison to forecast month-end landing versus last year.
Related KPIs
- Invoice Amount
- Invoice Amount PY
- Daily Sales
See the full KPI & measure catalog for definitions and formats.
Back to all Know Your Customer standard reports · Semantic model · Key business questions