Know Your Customer Standard Reports
The Know Your Customer app ships with the pre-built Power BI reports below. Start with the Daily Sales page, then drill into the specialized reports.
Reports in this module
| Report | What it covers |
|---|---|
| Daily Sales (this page) | The daily pulse of your sales - short-term figures, trends and a 7-day average. |
| Monthly Sales | Your monthly sales development against last year's run-up curve. |
| Customer Loyalty | Cohort analysis to see when you win new and lose existing customers. |
| Churn - Early Warning System | Get warned before a loyal customer silently churns. |
| Customer Clustering | Segment customers by order frequency and value to set service levels. |
| Shopping Basket Analysis | Discover which products are bought together to drive cross- and up-sell. |
| By Customer | A 360° view on customer performance - sales, margin and development. |
| By Item | An item-centric view to manage the product portfolio based on facts. |
| By Employee | Sales performance per salesperson, to steer teams based on objective data. |
Daily Sales
The daily pulse of your sales - short-term figures, trends and a 7-day average.
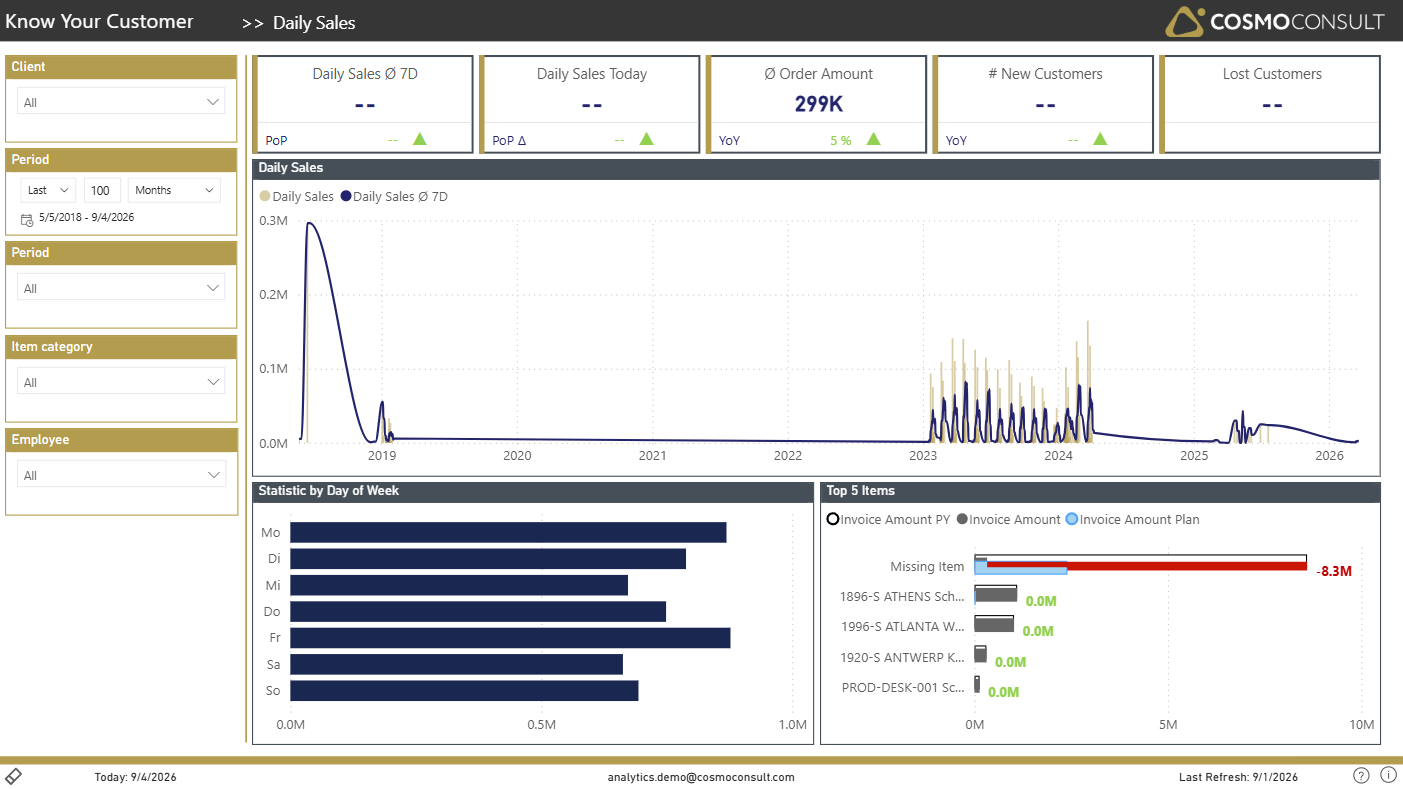
Use the Daily Sales page to keep a finger on the short-term pulse of the business. It brings the most important KPIs, daily sales figures including a 7-day moving average, short-term trends, a by-weekday statistic and your most important items together on a single screen.
At a glance
Generated from the report definition (DailySales / DailySales).
- Key visuals: 2× bar chart, line & column combo
What this report helps you do
- Track the most important KPIs and today's sales at a glance
- Follow daily sales figures with a smoothing 7-day moving average
- Spot short-term trends and unusual days early
- Understand sales distribution by day of week and your top items
Filters & slicers
| Filter | What it does |
|---|---|
| Client, Period / Date, Employee, Items | Focus the daily figures on a company, day range, salesperson or product portfolio. |
Visuals on this page
KPI Tiles
Management-level tiles for today's sales, the 7-day average, average order size and customer dynamics.
- Daily Sales Today and Daily Sales Moving Ø 7D show today's value against the smoothed trend
- # New Customers and # Lost Customers capture short-term customer dynamics
Daily Sales Trend
A combo chart plots daily sales with the 7-day moving average to separate noise from trend.
- Detect short-term momentum and outliers
- Compare raw daily volatility against the smoothed curve
Sales by Weekday and Top Items
A weekday statistic and an item comparison (actual vs. previous year and plan) round out the page.
- See which weekdays drive volume
- Identify the items contributing most in the current period
Typical use cases
- Daily Sales Standup — Review yesterday's and today's figures and short-term trends in the daily sales huddle.
- Anomaly Detection — Spot unusual spikes or drops against the 7-day average and react quickly.
Related KPIs
- Daily Sales
- Daily Sales Today
- Daily Sales Moving Ø 7D
- # New Customers
- # Lost Customers
- Ø Order Amount
See the full KPI & measure catalog for definitions and formats.