Operations (Gantt)
All historic, current and upcoming production tasks on a work center, with a setup-vs-run-time indicator for unproductive time.
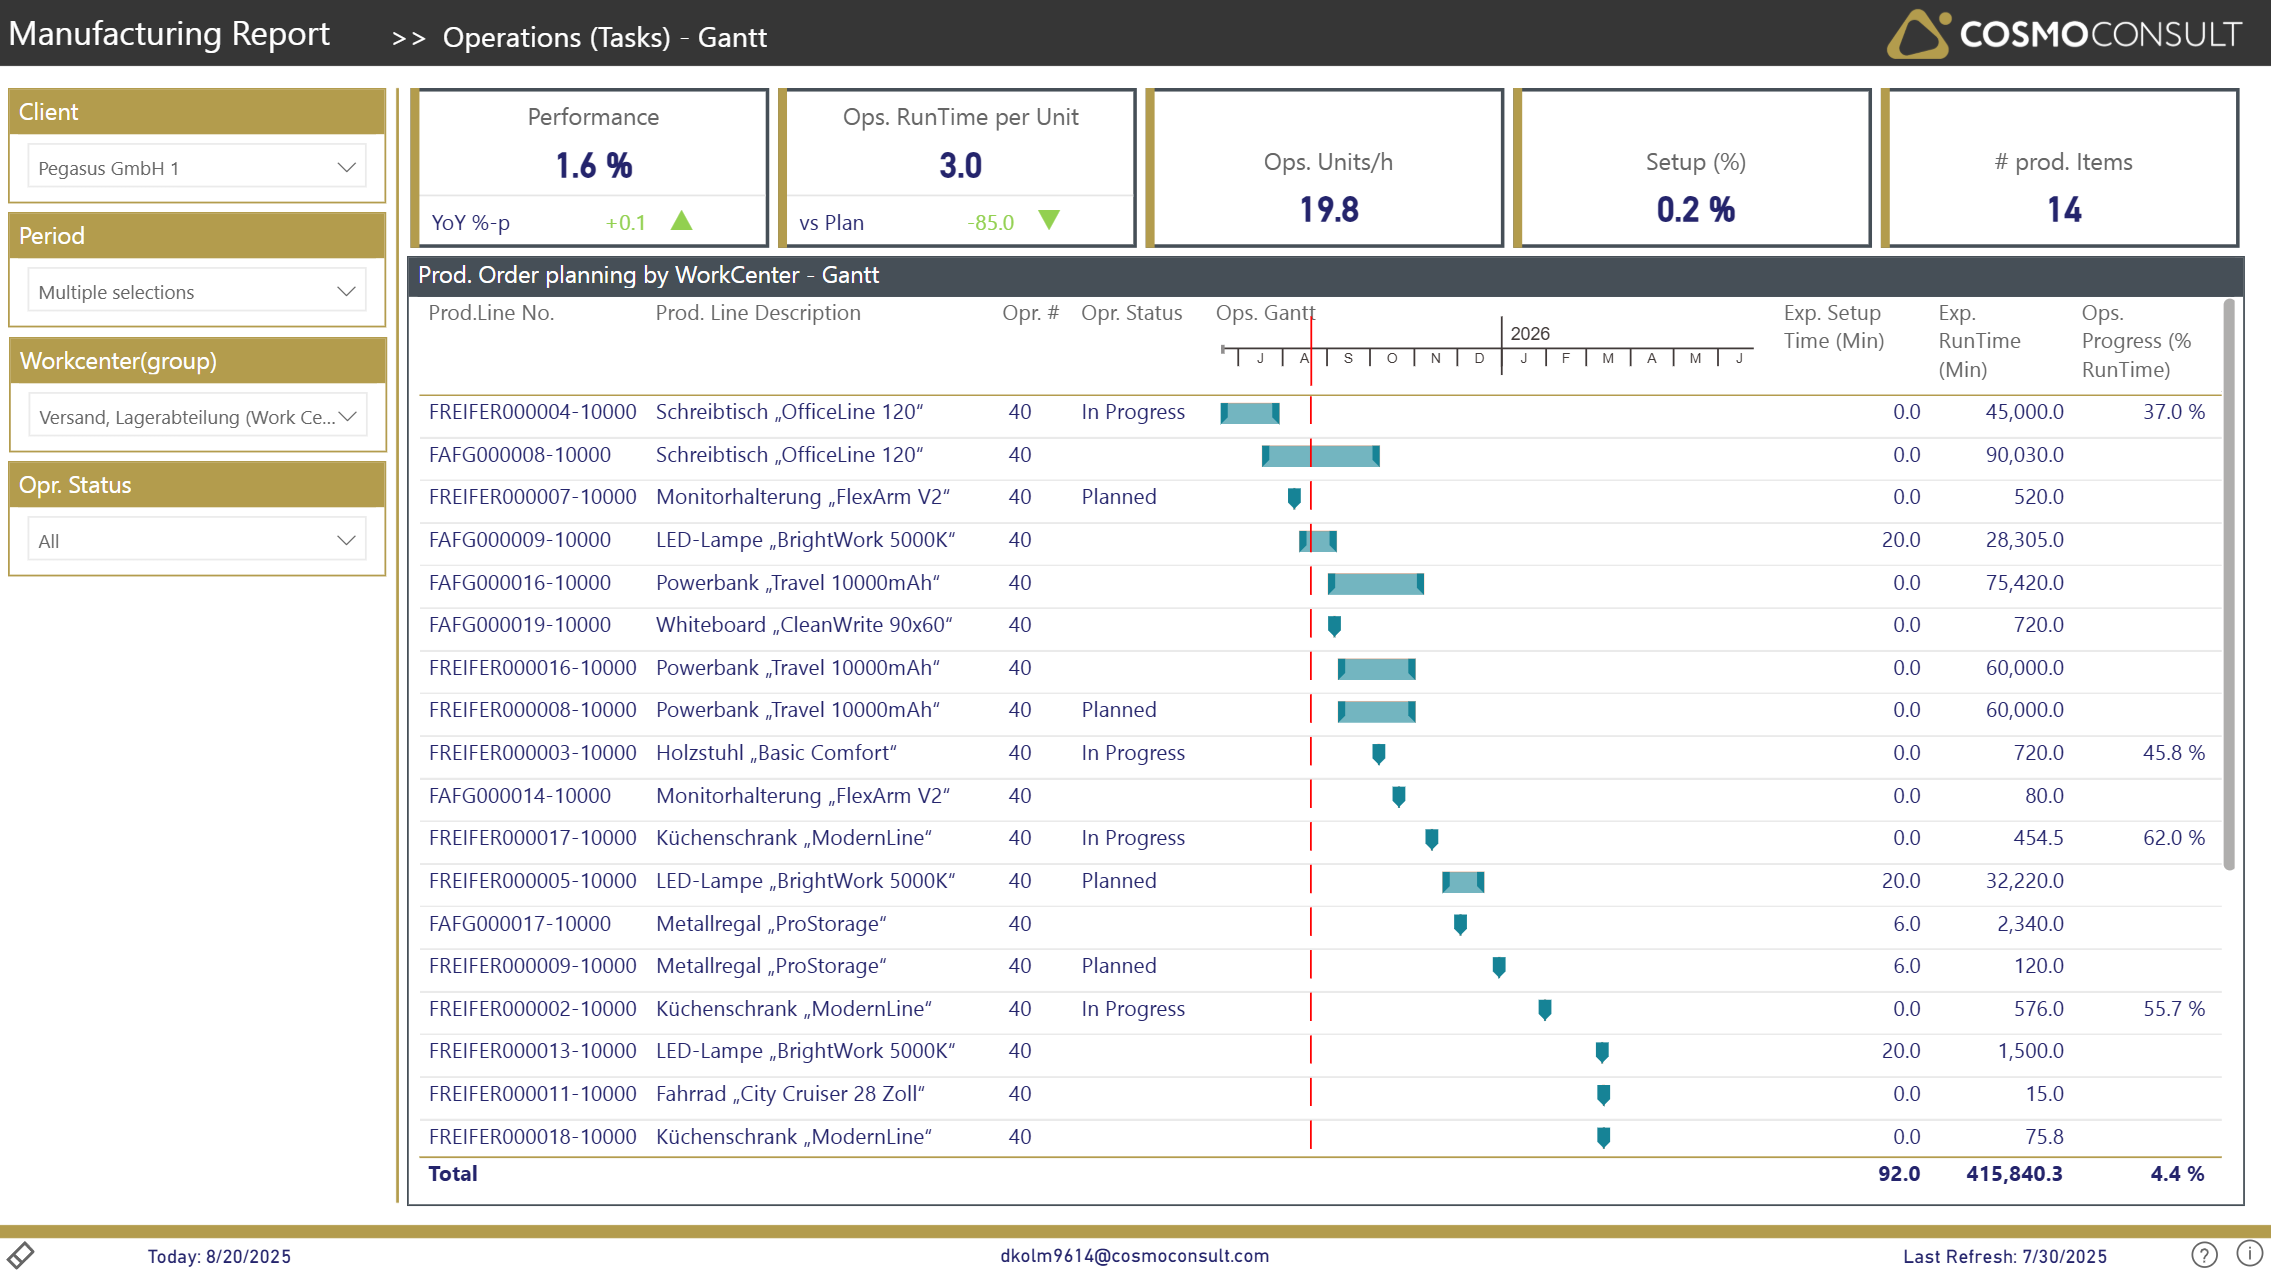
By filtering on a single work center using the slicer, you can display all historic, current and upcoming production tasks on this work center. The view is sorted by start date to easily get an overview of the status and progress of the respective tasks. Use it to analyze the number of changes in products manufactured on a specific work center, which may come along with high setup times.
At a glance
Generated from the report definition (Arbeitsgänge / Arbeitsgänge).
- Key visuals: matrix, table
What this report helps you do
- Display all tasks on a selected work center, sorted by start date
- Assess status and progress of current and upcoming tasks
- Analyze product changeovers that drive high setup times
- Identify overall unproductive time via the setup-vs-run-time share
Visuals on this page
Operations Gantt
Historic, current and upcoming tasks on the selected work center on a time-axis.
Setup-time share KPI
A KPI at the top indicates the share of setup time versus run time to identify overall unproductive times.
Typical use cases
- Changeover analysis — Reveal frequent product changes on a work center that inflate setup time.
- Sequencing improvement — Support better task sequencing to reduce unproductive setup time.
Related KPIs
- Setup (%)
- Ops. SetupTime (Min)
- Ops. RunTime (Min)
- Ops. Total Time (Min)
See the full KPI & measure catalog for definitions and formats.
Back to all Manufacturing (Discrete) standard reports · Semantic model · Key business questions