Prod. Order Statistic
A summary of the most important cost positions with deviations to planned figures, and a cost-group matrix.
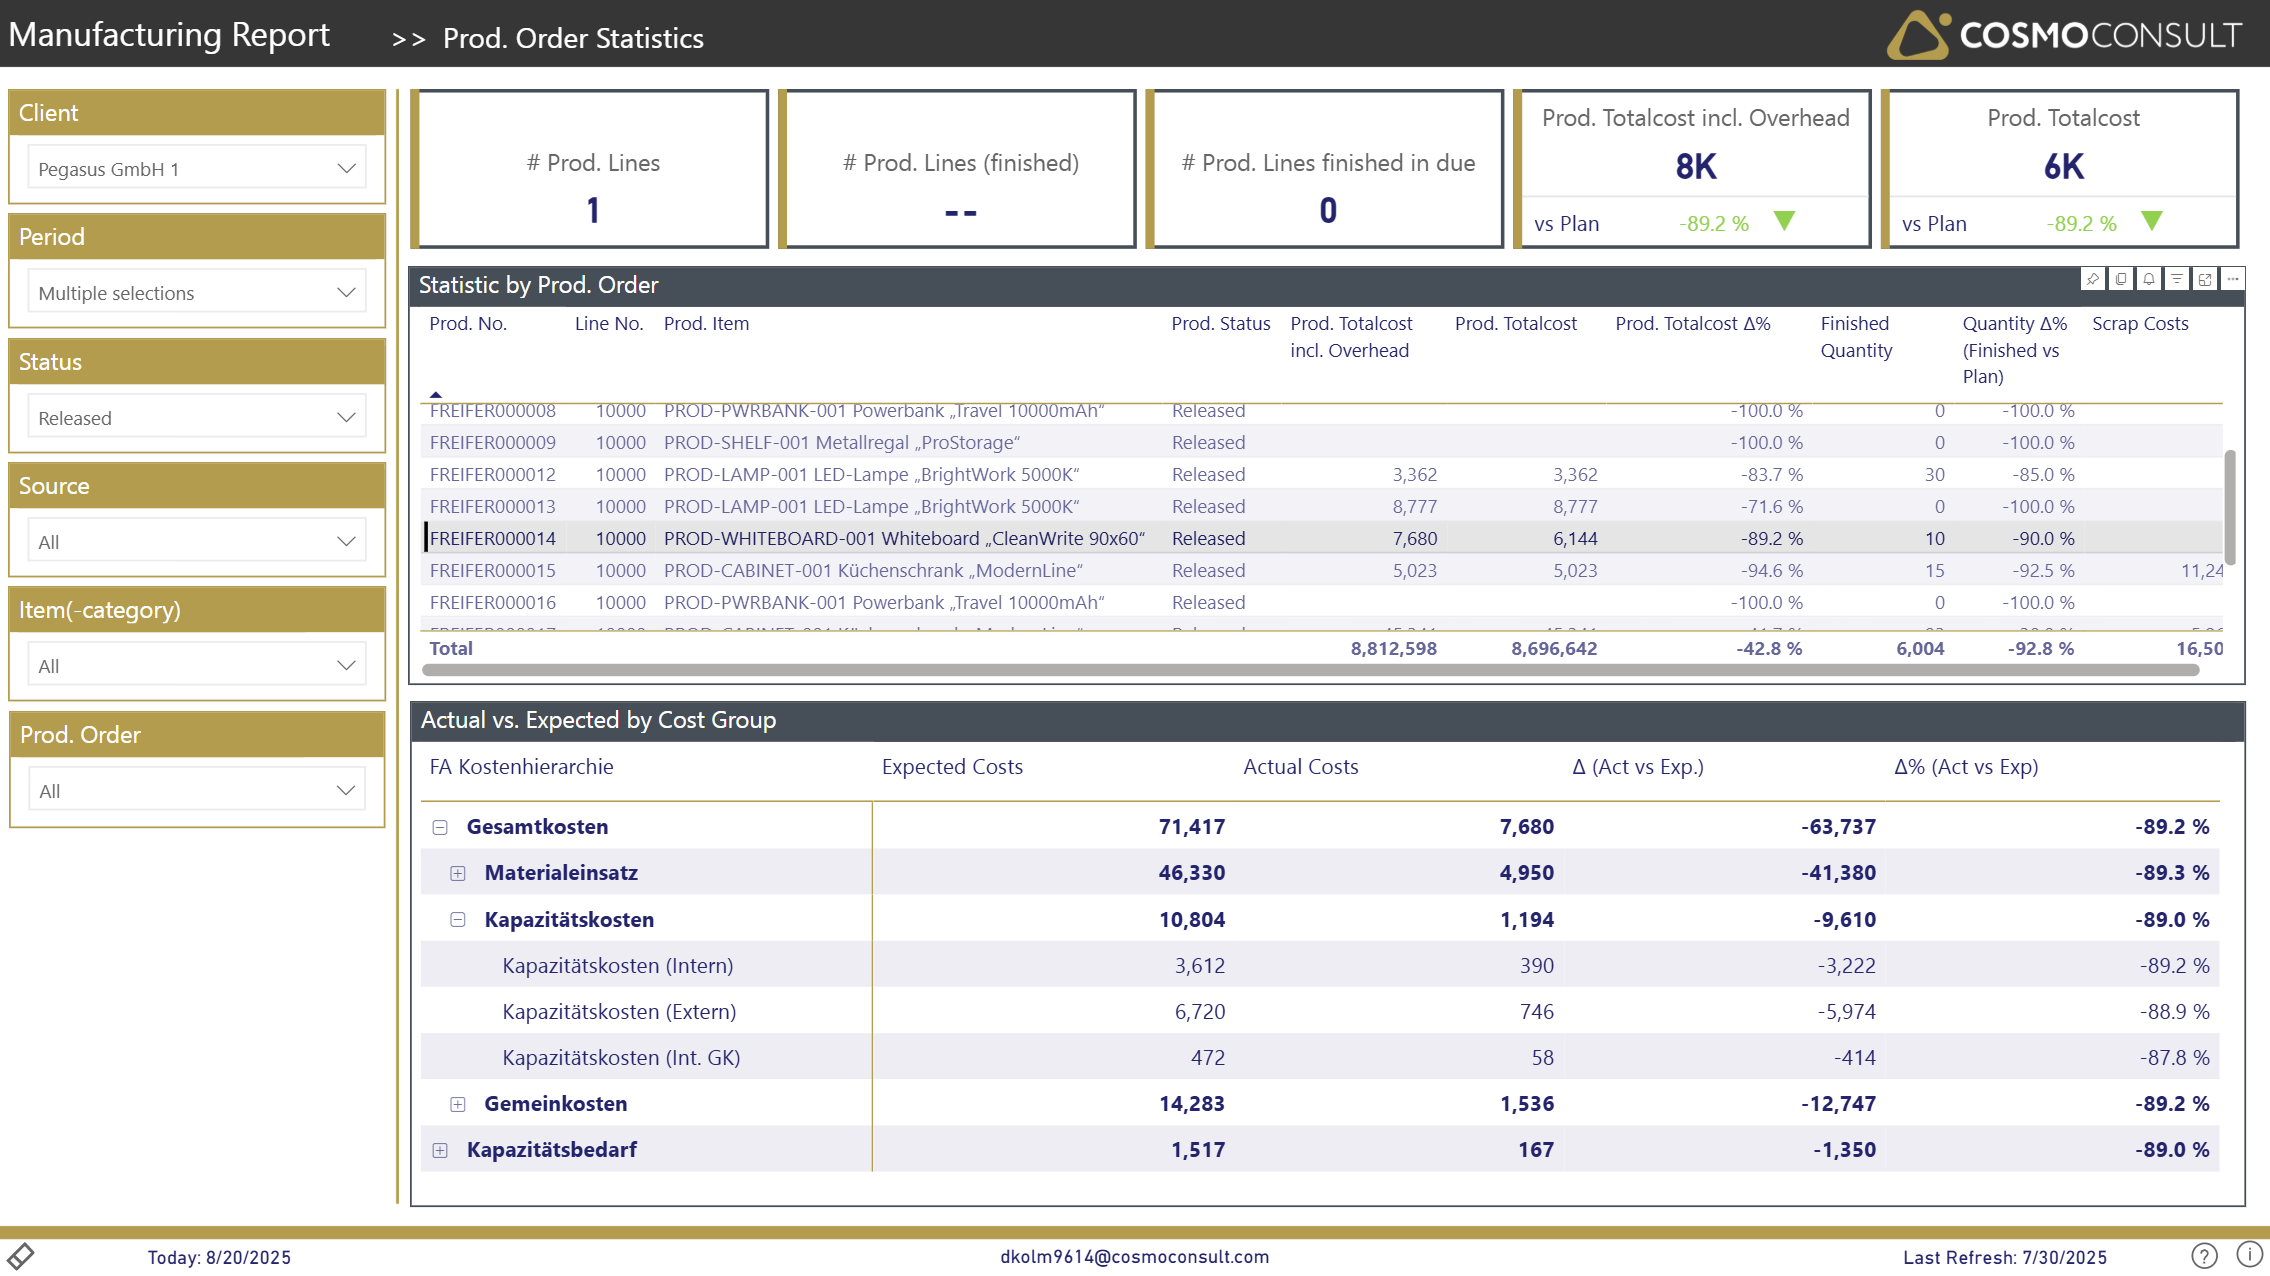
This report provides a brief summary of the most important cost positions like component, capacity or overhead costs and outlines deviations to planned figures. The table in the upper area can be used to sort production orders based on measures like total costs, deviations or scrap costs and acts as an interactive filter for the cost-group matrix below. Without interactive filtering (or filtering through the Prod. Order slicer), the statistic matrix shows an aggregate (e.g. of all finished production orders) depending on your slicer settings.
At a glance
Generated from the report definition (FA Statistik / FA Statistik).
- Key visuals: matrix, table
What this report helps you do
- Summarize component, capacity and overhead costs per production order
- Outline deviations of actual costs to planned figures
- Sort orders by total costs, deviations or scrap costs and drill into the cost-group matrix
Visuals on this page
Cost summary table
Sort production orders by total costs, deviations or scrap costs; use as an interactive filter for the matrix below.
Cost-group matrix
Actual versus expected costs by cost group; shows an aggregate when no single order is selected.
Typical use cases
- Cost-deviation control — Find the orders and cost groups with the largest deviations from plan.
- Cost-structure analysis — Understand the component, capacity and overhead cost mix per order or in aggregate.
Related KPIs
- Actual Costs
- Expected Costs
- Manufacturing Overhead
- ∆ (Act vs Exp.)
- ∆% (Act vs Exp)
See the full KPI & measure catalog for definitions and formats.
Back to all Manufacturing (Discrete) standard reports · Semantic model · Key business questions