Ops. Utilization (Outlook)
Monitor future load or idle times of your work center (groups).
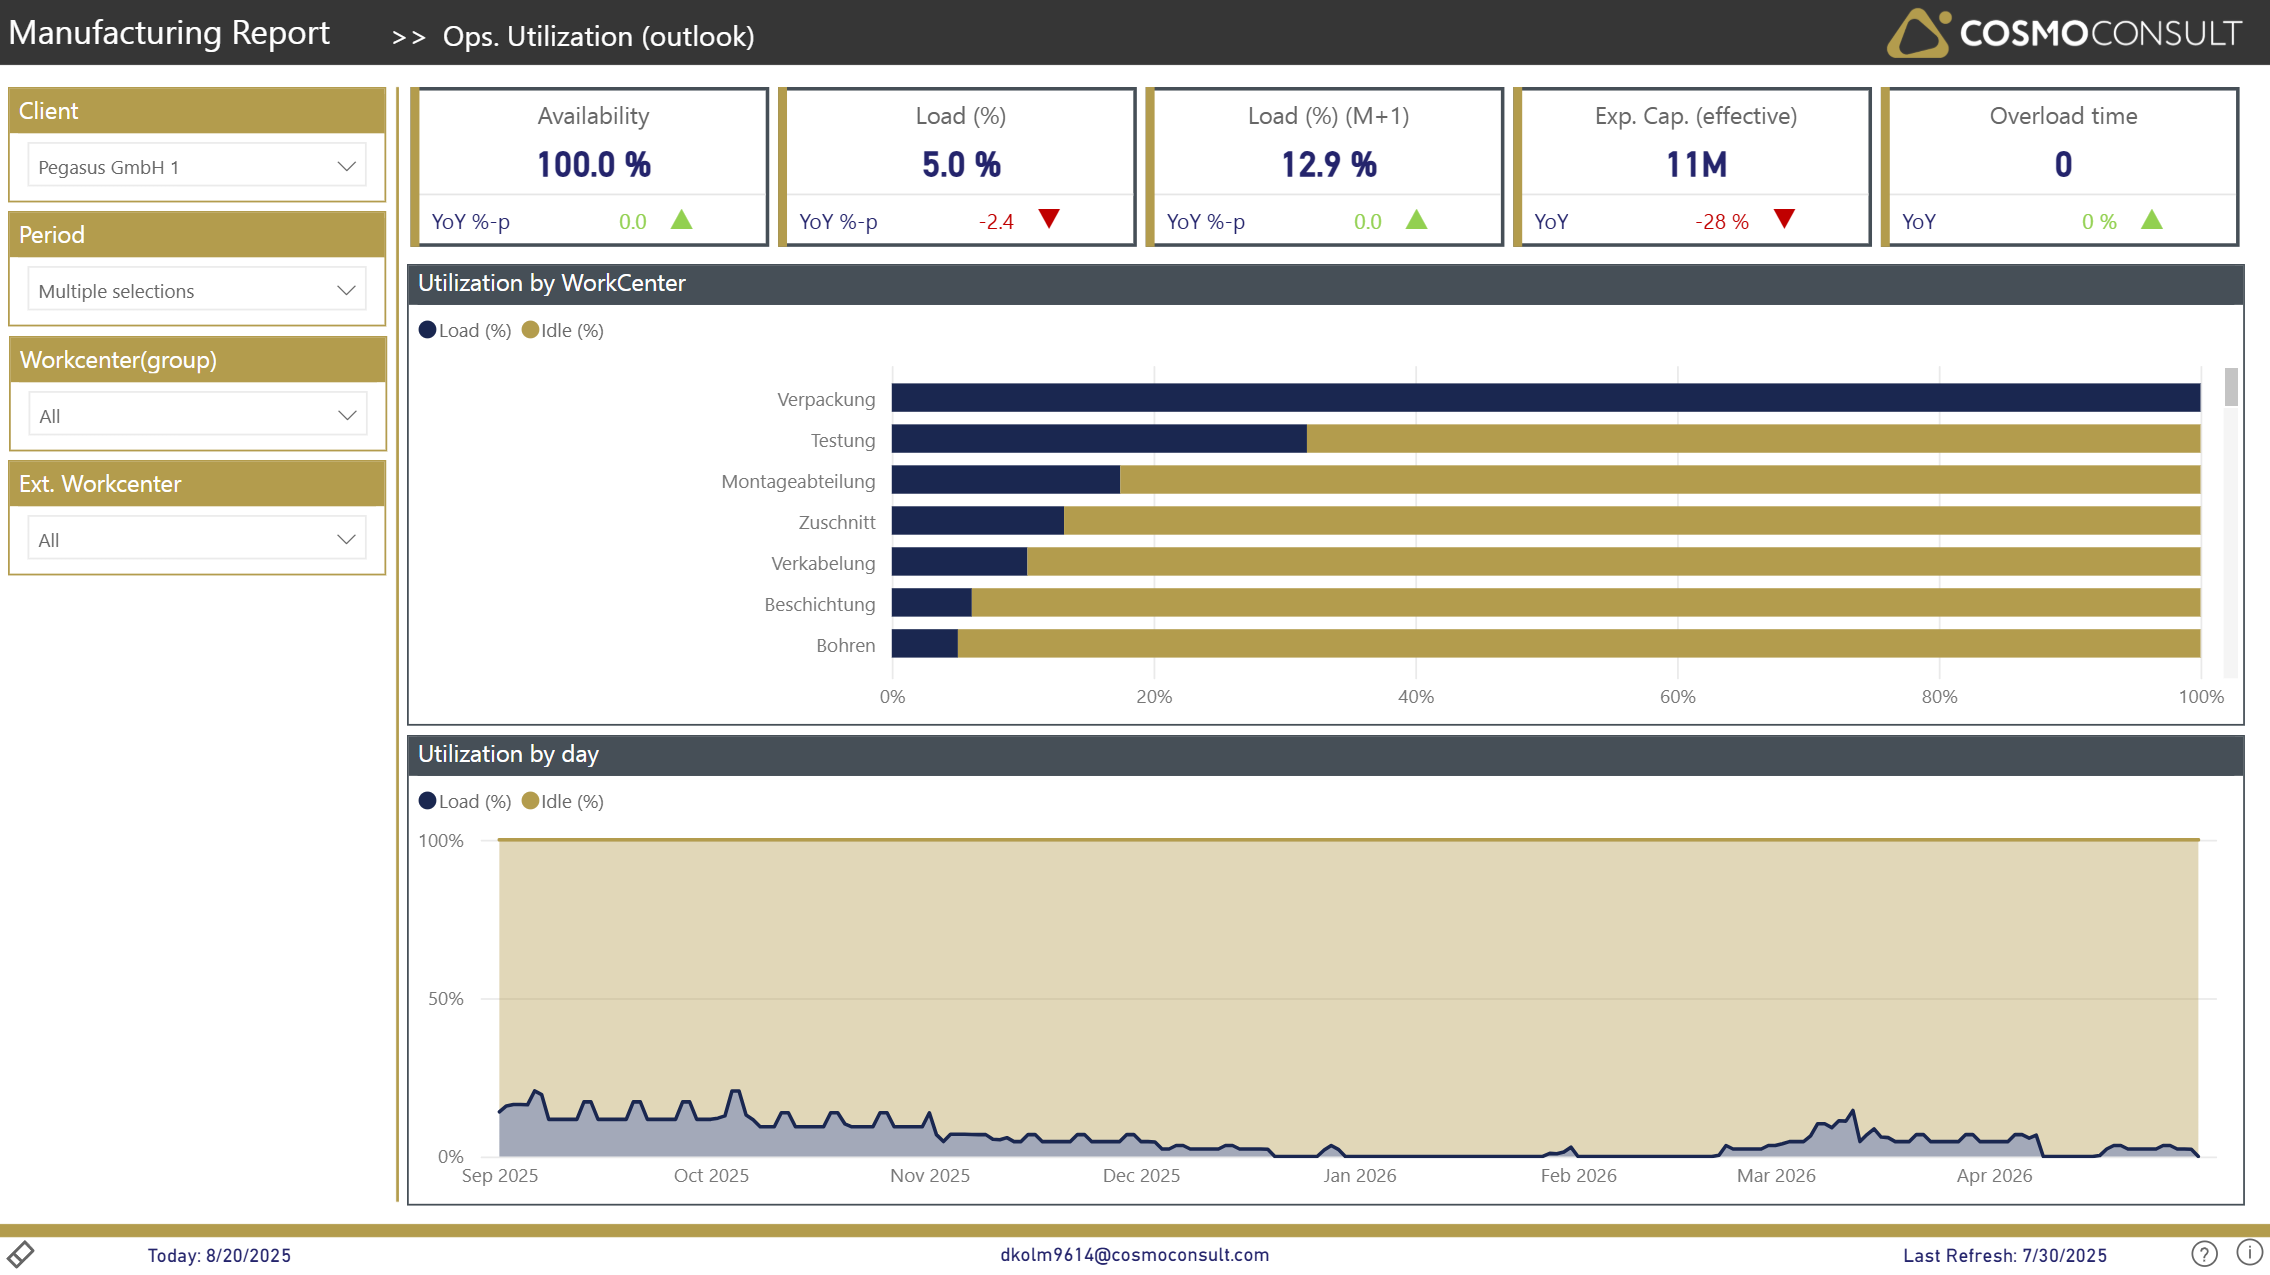
Use this report to monitor future load or idle times of your work center (groups). Ensure a future period is set in the slicer area; the analysis mirrors the Ops. Utilization (Historical) page but for the upcoming period.
At a glance
Generated from the report definition (APG Auslastung (Ausblick) / APG Auslastung (Ausblick)).
- Key visuals: hundredPercentStackedAreaChart, hundredPercentStackedBarChart
What this report helps you do
- Anticipate future load and idle times per work center (group)
- Spot upcoming overload or idle capacity before it happens
- Support short-term capacity and scheduling decisions
Visuals on this page
Future utilization by work center
Expected load per work center for the selected future period.
Future utilization per day
An area chart of expected utilization at a daily level.
Typical use cases
- Forward capacity planning — Rebalance load before overload or idle time materializes.
- Scheduling support — Decide where to place upcoming orders based on expected load.
Related KPIs
- Load (%)
- Load (%) (M+1)
- Exp. Cap. (effective)
- Time allocated
See the full KPI & measure catalog for definitions and formats.
Back to all Manufacturing (Discrete) standard reports · Semantic model · Key business questions