Ops. Utilization (Historical)
Analyze historical work-center (group) utilization down to a daily level.
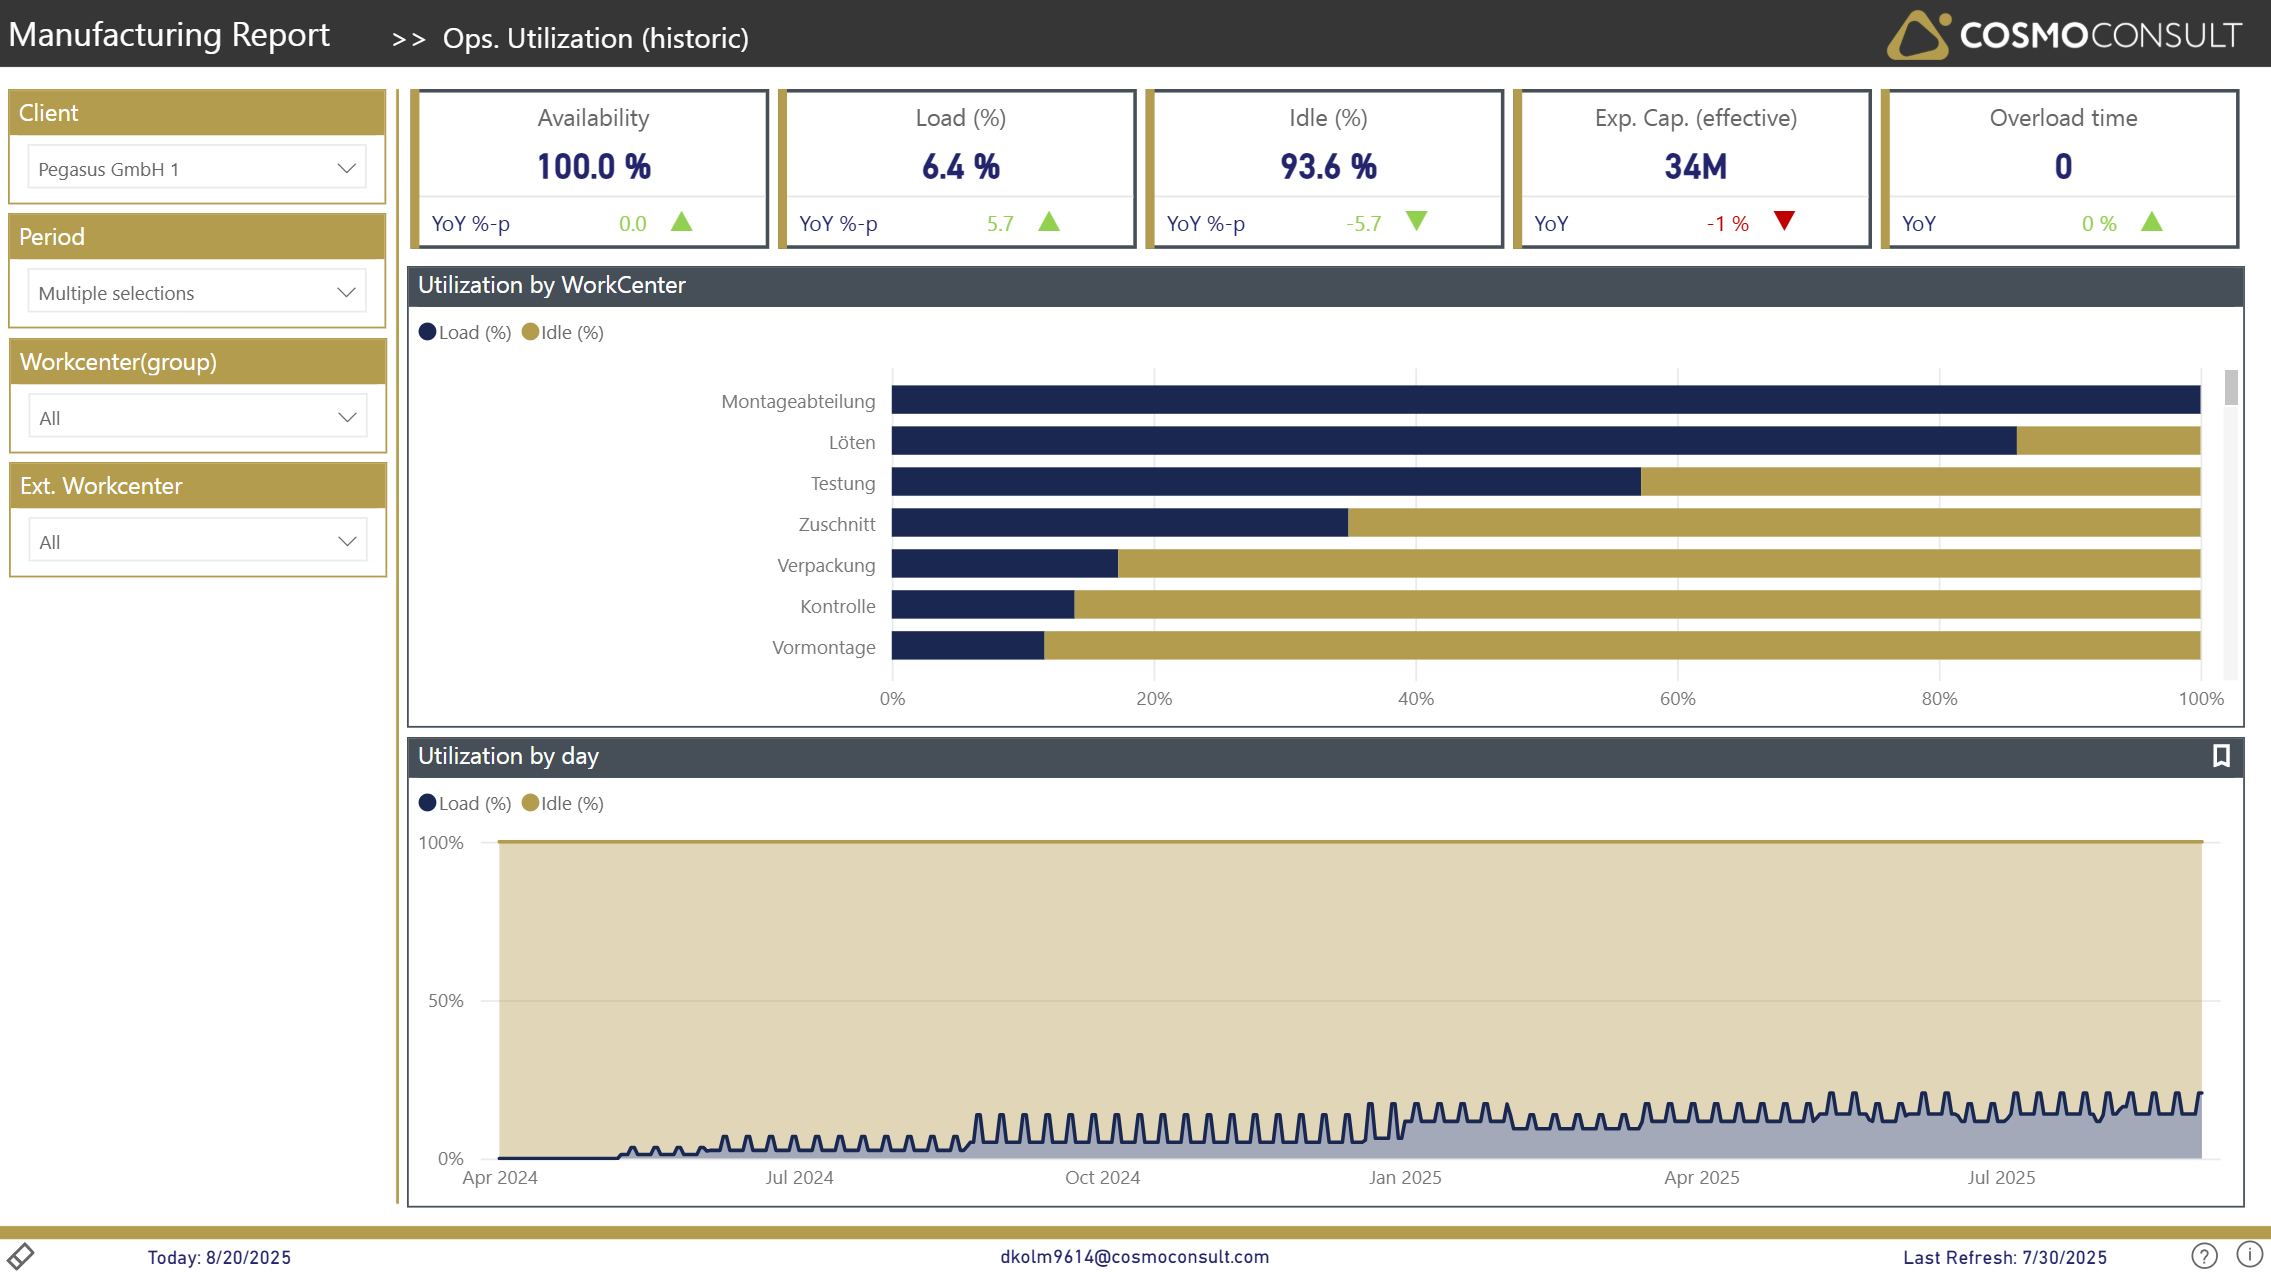
This report is used to analyze historical work-center (group) utilization. Slicers can be used to select specific work-center groups or just internal work centers. The upper area displays the utilization on a work-center level; this bar chart can be used for interactive filtering to display the utilization on the area chart at a daily level. If additional details are needed, the bookmark icon in the upper-right of the area chart can be used to display detailed table views.
At a glance
Generated from the report definition (APG Auslastung (Hist.) / APG Auslastung (Hist.)).
- Key visuals: hundredPercentStackedAreaChart, hundredPercentStackedBarChart, matrix
What this report helps you do
- Analyze historical utilization by work center or work-center group
- Restrict analysis to internal work centers
- Drill from work-center level down to a daily utilization curve
- Switch to a detailed table view via the bookmark icon
Visuals on this page
Utilization by work center
Historical utilization per work center; use it as an interactive filter for the daily view.
Utilization per day
An area chart showing utilization at a daily level for the selected work center(s).
Typical use cases
- Capacity review — Understand where work centers were over- or under-utilized in the past.
- Bottleneck detection — Identify recurring load peaks on specific work centers.
Related KPIs
- Load (%)
- Idle (%)
- Efficiency (%)
- Overload time
See the full KPI & measure catalog for definitions and formats.
Back to all Manufacturing (Discrete) standard reports · Semantic model · Key business questions